Introduction
Groundwater is an important natural resources with high economic value and social significance (Zhao Zhou, 2015). Groundwater supplies almost half of all drinking water in the world (WWAP, 2009) and plays a key role in food production, accounting for over 40% of the global consumptive use in agriculture irrigation (Siebert et al., 2010). Groundwater is the most extracted raw material in the world with a withdrawal rate around 980 km3/yr.
In EU, groundwater abstraction amounts to around 53 km3/yr. Groundwater abstraction constitutes a significant amount of total freshwater abstraction in many countries in Europe, ranging from 9% to almost 100%.
Groundwater abstraction is mostly used in agriculture, in particular in Southern countries with shares ranging from 0% to almost 100%.
In addition groundwater is a major contributor to abstraction for domestic use with shares ranging from 16% to 100%.
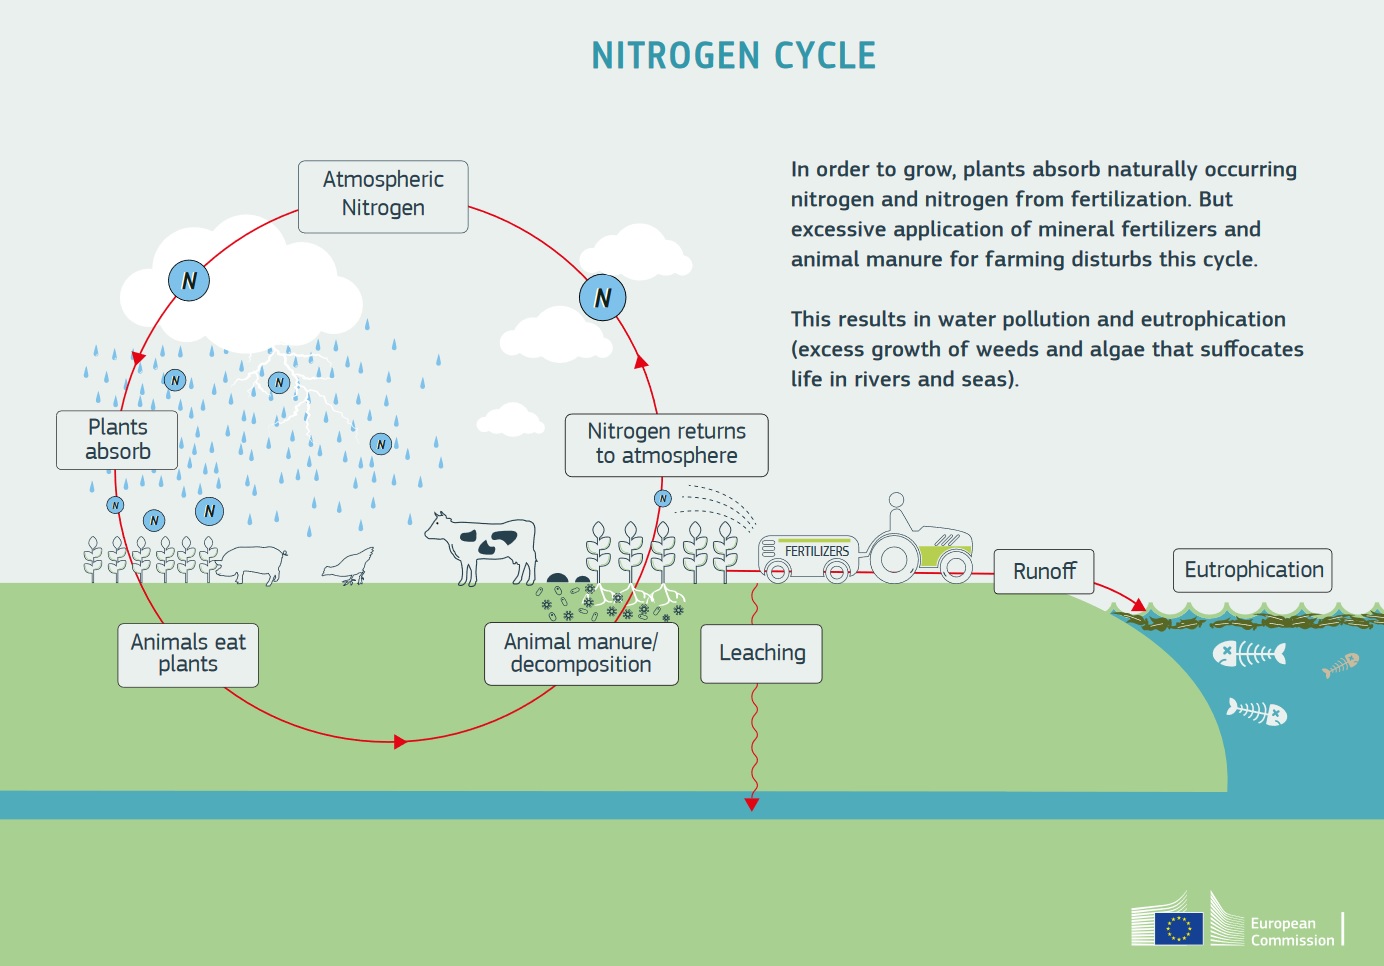
Groundwater thus plays a key role in sustaining human life and activities, however it is put at risk by overexploitation and water quality degradation. Climate and landuse change, and population growth are posing a variety of threats to groundwater thereby impacting both water quantity and quality. In particular, agriculture is the largest contributor of nitrogen pollution to groundwater. Nitrate is soluble and has a high mobility and potential for loss from the unsatured zone by leaching (Almasri et. al., 2007). Many studies showed the direct link between agriculture and nitrate concentration in groundwater (Dunn et al., 2005; Liu et al., 2005; Hansen et al., 2012). The extensive use of fertilizers is considered to be a main source, and in particular diffuse source, of nitrate that leaches to groundwater (Almasri et. al., 2007). As well, point sources, including septic tanks, broken sewage systems, contribute to nitrate pollution in the groundwater (MacQuarrie et al., 2001).
Human activities have altered significantly the nitrogen cycle resulting in high emission of nitrate to the environment leading to significant water quality degradation, loss of biodiversity and intensification of the eutrophication phenomena. Contamination of ground water can result in poor drinking water quality, loss of drinking water supply, degraded surface water systems, leading to higher costs for cleanup or alternative water supplies, and to potential health problems (van Grinsven et al., 2010).
However, assessing the effectiveness of the adopted action programs remain complex because the limited number of monitoring points, not uniformly distributed all over Europe, constrains the possibility to extrapolate information in non-monitored areas. Nowadays it is recognized that strategies that protect groundwater must be based upon reliable forecasts of the risk of groundwater pollution under a variety of possible future climate, socioeconomic and land use scenarios (Twarakavi and Kaluarachchi, 2006). For that reason, various approaches have been applied to estimate the groundwater vulnerability and to predict nitrate concentration in groundwater. They can be grouped into methods based on the use of:
- process-based simulation models (e.g. SWAT-MODFLOW model; Conan et al., 2003);
- statistical models (e.g. step wise approach; Liu et al., 2017);
- overlay and index methods (e.g. DRASTIC method; Aller et al., 1985, 1987).
In addition, scenario analysis of landuse, climate and nutrient input changes can help identifying medium or long term critical locations in the face of environmental changes. Infact, groundwater quality is expected to respond to changes in climate and anthropogenic activities due primarily to the influences of recharge and land use on groundwater systems (Green et al., 2011). Climate change can potentially alter the vulnerability of shallow aquifers by affecting depth-to-water table and recharge (Pointer, 2005; Scibek and Allen, 2006; Toews and Allen, 2009), and human activities such as changes in landuse can also affect groundwater vulnerability (Li and Merchant, 2013).
Groundwater quality
Protecting groundwater is high on the European Commission agenda. The WFD and its daughter Groundwater Directive aim at achieving good quantitative and qualitative status of groundwater bodies. The Nitrates Directive aims at preventing and reversing any degradation of groundwater by nitrates from agricultural activities.
The Nitrates Directive has been in place since 1991, and sets clear standard water quality limits. To achieve environmental objectives Member States (MS) are required to identify waters affected (or potentially affected) by pollution. Pollution, as defined in Annex I of the Directive, refers to waters where nitrate concentrations are larger than 50 mg NO3/l and water bodies are affected by eutrophication or will be affected if no action is taken. The Directive requires Member States to identify Nitrate Vulnerable Zones (NVZ) which are the areas draining in the previously identified areas and which contribute to pollution. The Directive establishes control of pollution at the source by limiting the amount of applied manure. To protect waters against pollution MS are required to establish a Code of Good Agricultural Practices to be implemented on a voluntary basis. The implementation of this code is mandatory on all NVZ in addition to other measures such as manure management which limit the application of organic N at 170 kg/ha, etc. The Directive also requires MS for the purpose of designation and revising the designation of the NVZ to set up monitoring programs. An evaluation report is published by the Commission every four years.
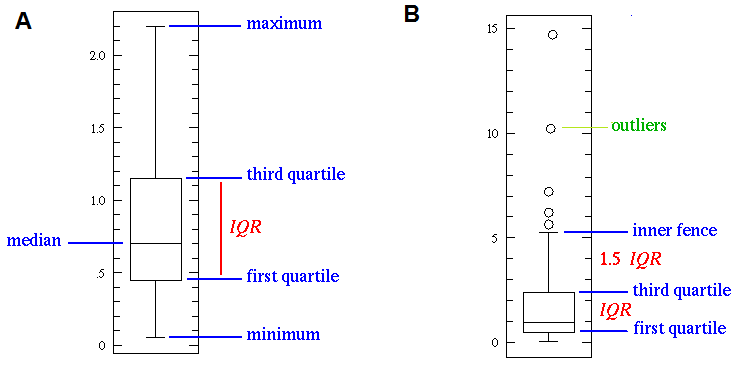
National trends of groundwater quality are calculated using the official monitoring dataset sent by Member States to the European Commission. The trends are displayed for all the 6 reporting periods (when available). For each reporting period we present a box plot of the nitrates concentrations (median, upper and lower quantiles, in addition to the average annual nitrate concentration). It is important to stress that the monitoring network changes in time and that there is a high turnover of the monitoring stations used by the Member States.
Trend of groundwater quality at national level every 4 years from 1990
Member States also report for each monitoring station its depth or characteristic class:
- 0: Phreatic groundwater (shallow) 0-5 m
- 1a: Phreatic groundwater (deep) 5-15 m
- 1b: Phreatic groundwater (deep) 15-30 m
- 1c: Phreatic groundwater (deep) >30 m
- 2: Captive groundwater
- 3: Karstic groundwater
Among other criteria, national trends of groundwater concentration by depth class for the last two reporting period provides valuable information for taking appropriate measures. Other criteria, such as water age, also play an important role.
Nitrates concentration in each depth level in report 5 (2008-2011) and 6 (2013-2015) for each country
Despite the improved observed in several groundwater bodies, many bodies are still eutrophic or characterized by large nitrate concentrations. The system memory is one of the factors that contributes to this. Developing further understanding of aquifer residence time and time lag between measures and their effects on groundwater will assist managers in designing measures to implement the Directive. To this end, we have developed three specific studies aiming at identifying the groundwater vulnerability, the groundwater residence time and to quantify nitrate concentration at various depths using environmental explanatory variables.
Combining these three layers of information will inform managers on the possible impacts of implementation of management measures on groundwater quality. Under the Directive, Member States are inter alia obliged to take account of the physical and environmental characteristics of the waters and the land, the current understanding of the behaviour of nitrogen compounds in the environment (water and soil), and the current understanding of the impact of the action taken. They must also include in their four-yearly reports the assumptions made about the likely timescale within polluted waters are expected to respond to the measure in the action programme, along with an indication of the level of uncertainty incorporated in these assumptions.
Groundwater vulnerability
Groundwater vulnerability is a term used to represent the natural ground characteristics that determine the ease with which groundwater may be contaminated by human activities. The groundwater vulnerability can be intrinsic or specific (NRC, 1993): the intrinsic vulnerability of an aquifer can be defined as the capacity with which a contaminant introduced at the ground surface can reach and diffuse in groundwater (Vrba and Zaporozec, 1994).
The specific vulnerability is used to define the vulnerability of groundwater to a particular contaminant or a group of contaminants and is calculated by the combination of the intrinsic vulnerability with an indicator (proxy) of the specific pollutant of interest. The intrinsic vulnerability was calculated using an index method called DRASTIC (Aller et al., 1985). The method is formulated as a weight sum of hydrogeological factors that are related to the movement of pollutants from the ground surface to the aquifer (Aller et al., 1985). These factors include: the depth of groundwater (D factor), the net recharge (R factor), the aquifer media (A factor), the soil media (S factor), the topography (T factor), the impact of vadose zone (I factor) and the hydraulic conductivity (C factor). This simple model is very flexible and was adopted to incorporate other factors, such as the landuse (L factor) and nitrogen inputs (N factor) to calculate the specific vulnerability.
The intrinsic vulnerability map indicates that the Pianura Padana and the Puglia Region in Italy, the French administrative regions Aquitaine, Poitou Charentes, the Centre of France, the Ile de France, the Picardie, the Nord Pas the Caleas are characterized by very high intrinsic vulnerabilities. The proximity of the groundwater level to the soil surface, the low slopes and the presence of unconsolidated and carbonate sedimentary rocks in these regions explain this high intrinsic vulnerability. Instead, the high vulnerability in the north of Germany, in Belgium, and Netherlands, as well as in the North-East part of Europe can be explained by the highest recharge, low water table and unconsolidated sediments. The center Ireland as well as the lower Bayern in Germany are also considered vulnerable due to the high presence of carbonate rocks and low water table depth. Low and very low vulnerable zones are generally observed in mountains areas where slopes are high, and the water tables deep.
The specific vulnerability to nitrate reflects the risk associated to land use and nitrogen input from mineral fertilizers, manure, atmospheric deposition and fixation. We observe high specific vulnerability in the areas classified as moderate, high, or very high intrinsic vulnerability due to the combined effects of the shallow water tables in alluvional areas, their interconnection with surface water and the excess of nitrate fertilizers applied. Areas with low or very low intrinsic vulnerability, i.e. in Spain, are also characterized by high to very high specific vulnerability due to the risks associated with irrigation and rainfed agriculture (Arauzo et al., 2017)
The aquifer residence time
Determination of the lag time is an important factor to design and implement measures reducing and preventing nitrates pollution, as legacy sources continue to supply significant nutrient fluxes to water bodies long after that other nutrients inputs have decreased or even halted (Chen et al., 2018).
Longer residence time is not an obstacle to evaluating the efficiency of the measures taken under the Directive, as several approaches already implemented show. Age of groundwater can be an essential component for the evaluation the impact of agricultural N mitigation measures on groundwater nitrate concentrations. Also, certain parameters respond rapidly to changes in nutrient management: the residual nitrate concentration in the upper layer of the soil, nitrate concentration in the upper groundwater of sandy soils, nitrate surplus (difference between the nitrogen inputs by fertilizers and manure and the nitrogen output by harvested crop).
Developing information to characterize the lag time is, among other factors, an important element to implement legislation. A large body of literature is available on the intrinsic hydrologic lag time, i.e. the time it takes for a dissolved particle to travel from the application point to a designated end point, like a stream for groundwater or a water body outlet for surface water (Vero et al., 2008). Hydrologic surface travel time ranges from days to weeks in surface runoff but can exceeds several decades and centuries in groundwater, reservoirs and lakes (Chen et al., 2018). Recent literature is also documenting the biogeochemical legacy effect, which refers to the cycling of nutrient in the soils, sediments and biota with residence times ranging from 10 years to several decades (Basu and Burras, 2016; Chen et al., 2018).
Prediction of nitrate concentration in groundwater
In order to predict the potential impacts of management measures on groundwater quality we developed a regression model putting in relation the nitrate concentration with environmental variables including climatic, soil, hydrogeological, and management data.
This approach allows first to estimate the nitrates concentration where no monitored data is available. In addition the regression model could be used to predict the impact of management variables like fertilizer application or irrigation on nitrate concentration. The NO3 concentration (mg/l) at any aquifer depth is estimated using a step wise linear regression. The maps show the distribution of NO3 concentration across Europe at different depths.
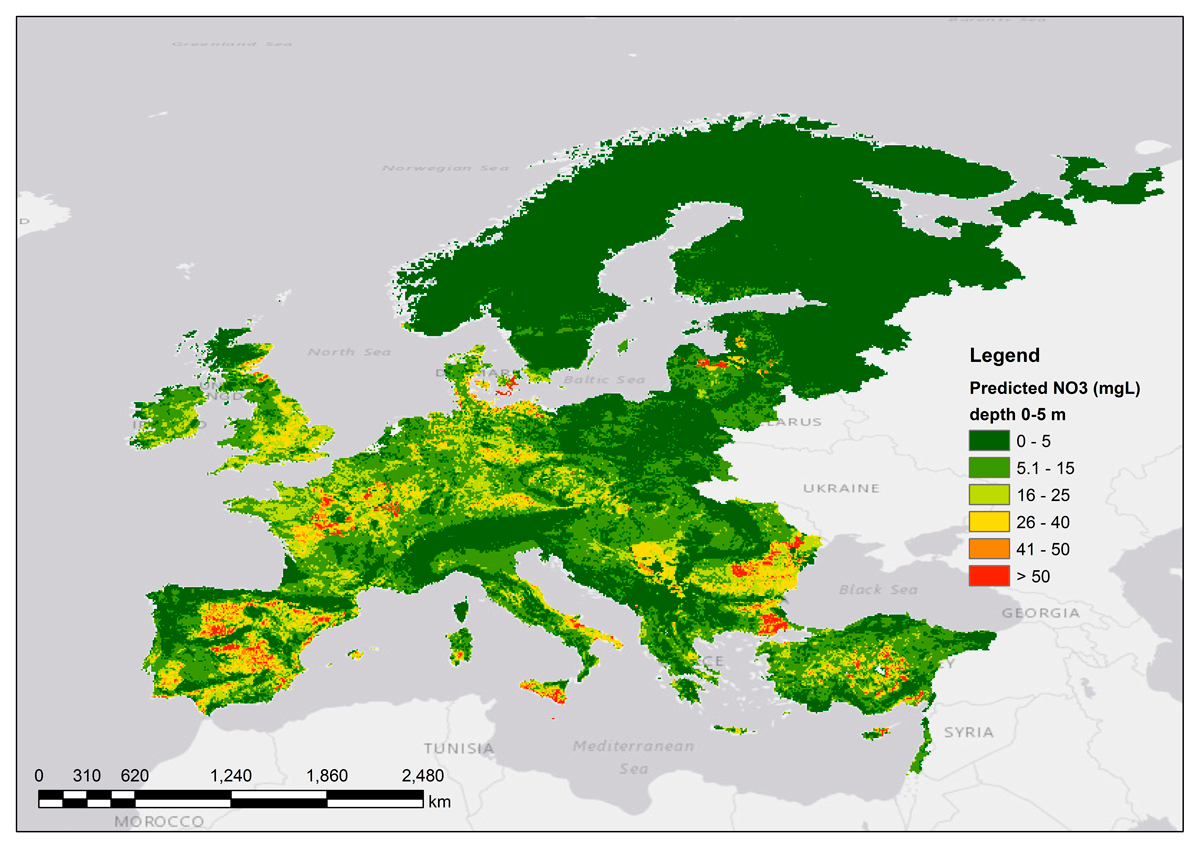
Predicted NO3 concentration (mg/l) in shallow aquifer (0-5 m of depth)
© Copyright JRC
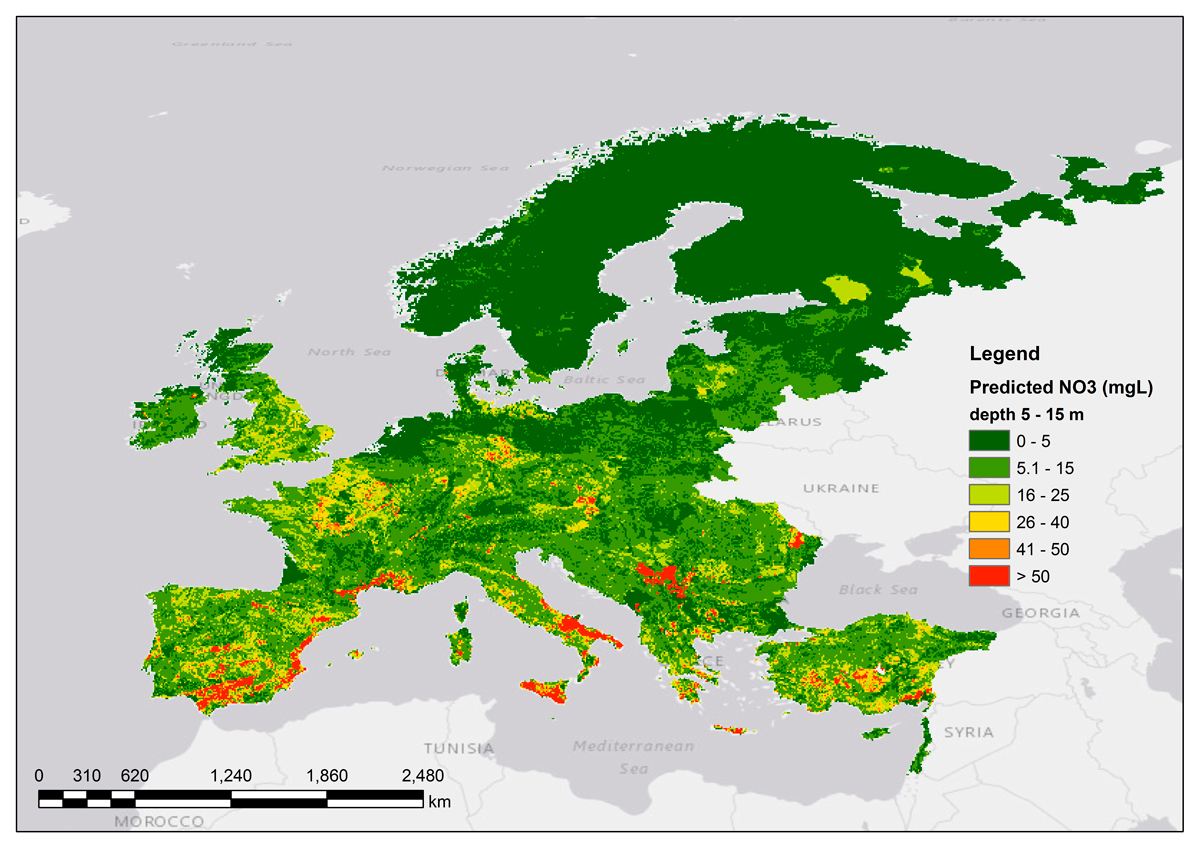
Predicted NO3 concentration (mg/l) in deep aquifer (5-15 m of depth)
© Copyright JRC
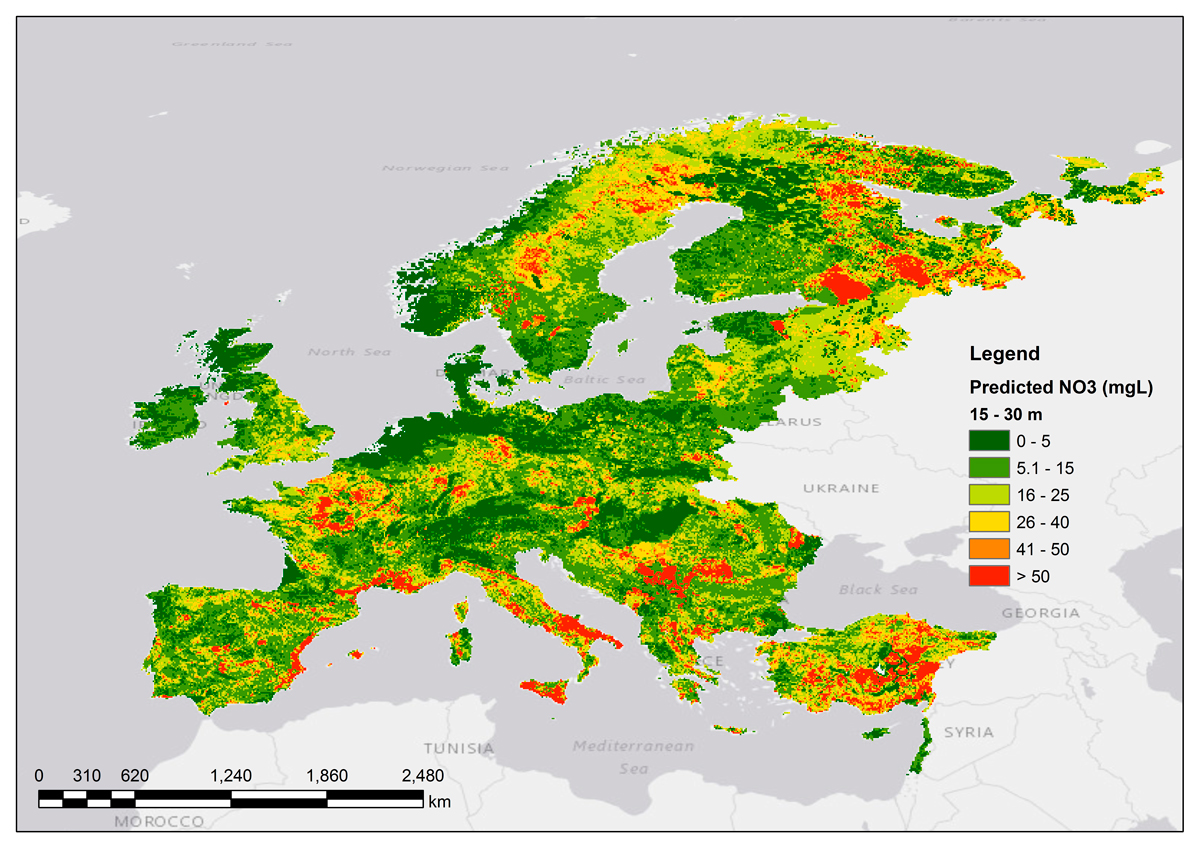
Predicted NO3 concentration (mg/l) in deep aquifer (15-30 m of depth)
© Copyright JRC
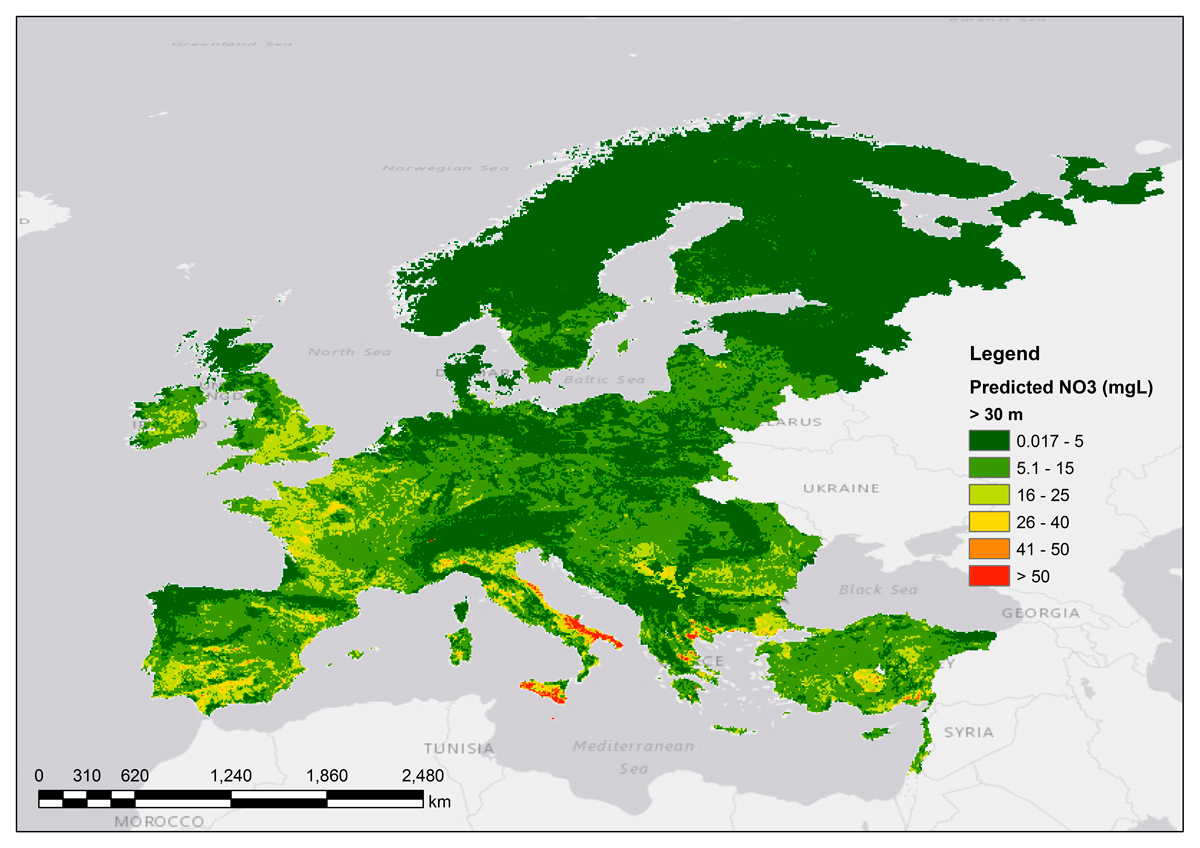
Predicted NO3 concentration (mg/l) in deep aquifer (> 30 m of depth)
© Copyright JRC
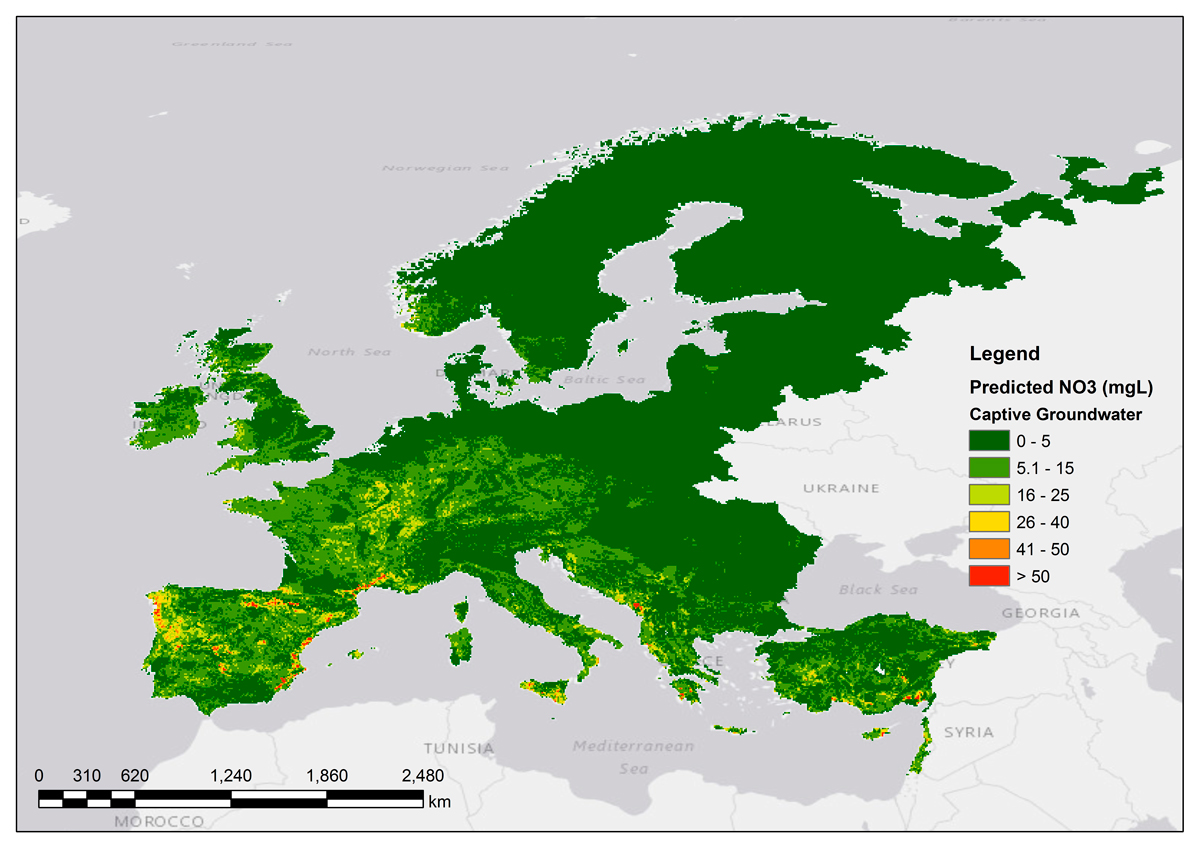
Predicted NO3 concentration (mg/l) in captive groundwater
© Copyright JRC
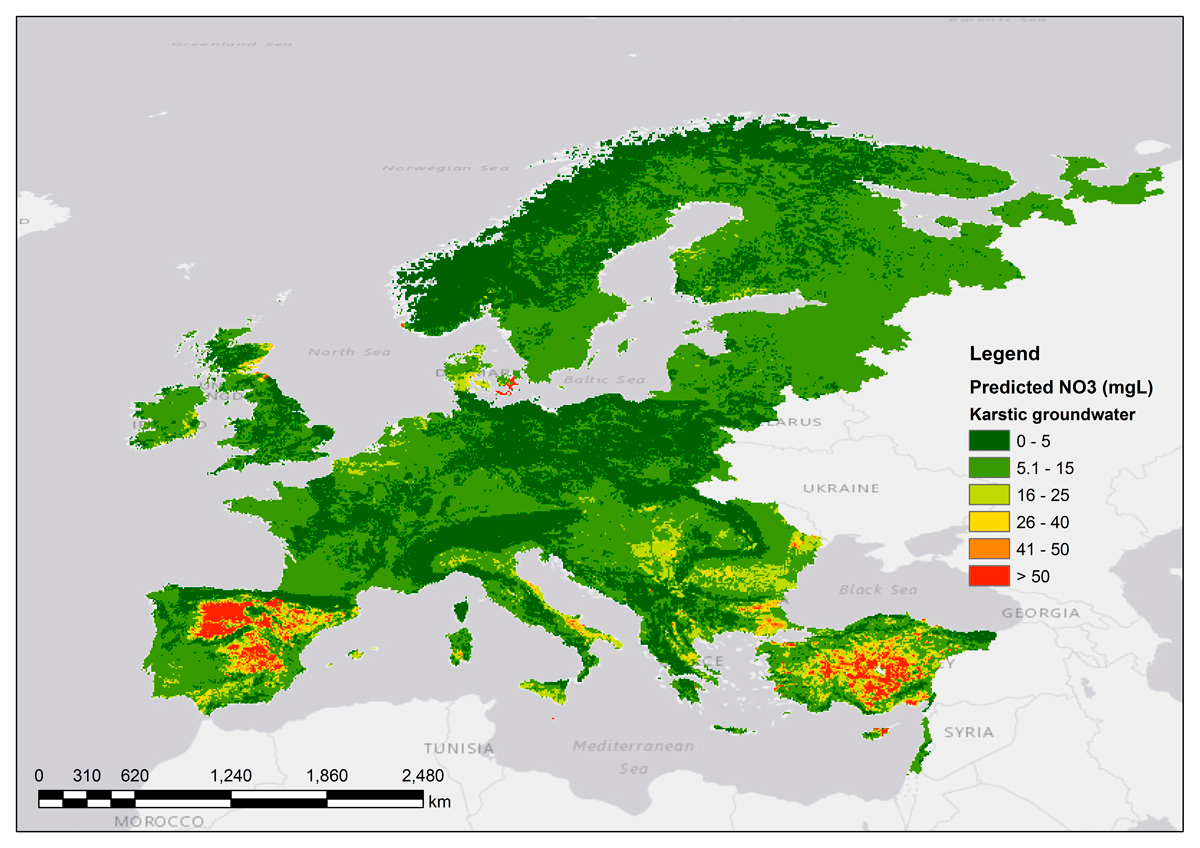
Predicted NO3 concentration (mg/l) in karstic groundwater
© Copyright JRC
Additional resources
European Commission
References
Aller, L., Bennett, T., Lehr, J.H., Petty, R.J. and Hackett G. (1987). DRASTIC: a standardized system for evaluating ground water pollution potential using hydrogeologic settings, United States Environ Prot. Agency, Ada, Oklahoma 74820, EPA 600/2-85/018, 455p.
Aller, L., et al., 1985. DRASTIC: A standardized system for evaluating ground water pollution potential using hydrogeologicsettings. NWWA/EPA Series EPA-600/2-85/018.
Almasri, M.N. (2007). Nitrate contamination of groundwater: A conceptual management framework. Environmental Impact Assessment Review, 27, 220-242.
Arauzo Mercedes (2017). Vulnerability of groundwater resources to nitrate pollution: A simple and effective procedure for delimiting Nitrate Vulnerable Zones. Science of the Total Environment, 575: 799-812.
Basu N.B. AND Burras C.L. (2016). The nitrogen legacy: emerging evidence of nitrogen accumulation in anthropogenic landscapes, Environmental Research Letters, 11.
Chen, D.J., Shen, H., Hu, M.P., Wang, J.H., Zhang, Y.F., Dahlgren, R.A. (2018). Legacy nutrient dynamics at the watershed scale: principles, modeling, and implications. Adv. Agron. http://dx.doi.org/10.1016/bs.agron.2018.01.005.
Conan C., Bouraoui F., Turpin N., Marsily G., Bidoglio G. (2003). Modeling flow and nitrate fate at catchment scale in Brittany (France). J Environ Qual, 32:2026–2032.
Dunn, S.M., Vinten, A.J.A., Lilly, A., DeGroote, J., McGechan, M. (2005). Modelling nitrate losses from agricultural activities on a national scale. Water Sci Technol., 51(3–4):319–27.
Green, T.R., Taniguchi, M., Kooi, H., Gurdak, J.J., Allen, D.M., Hiscock, K.M., Treidel, H., Aureli, A. (2011). Beneath the surface: impacts of climate change on groundwater. J. Hydrol. 405, 532–560.
Hansen, B., Dalgaard, T., Thorling, L., Sørensen, B., and M. Erlandsen (2012). Regional analysis of groundwater nitrate concentrations and trends in Denmark in regard to agricultural influence. Biogeosciences, 9, 3277–3286.
Li, R., and W. Merchant (2013). Modeling vulnerability of groundwater to pollution under future scenarios of climate change and biofuels-related land use change: A case study in North Dakota, USA.
Liu Aiguo, Ming Jinghua, Ankumah Ramble O (2005). Nitrate contamination in private wells in rural Alabama, United States. SciTotal Environ., 346:112–20.
Liu, J., Jiang, L.H., Zhang, C. J., Li, P., Zhao, T.K. (2017). Nitrate-nitrogen contamination in groundwater: spatiotemporal variation and driving factors under cropland in Shandong Province, China.
MacQuarrie K.T.B., Sudicky E., Robertson, W.D. (2001). Numerical Simulation of a fine grained denitrification layer for removing septic ystem nitrate from shallow ground water. J. Hydrolo., 52:29-55.
Margat, J. and van der Gun, J. (2013). Groundwater around the World: A Geographic Synopsis. CRC Press/Balkema. Leiden.
NRC (National Research Council) (1993) Ground Water Vulnerability Assessment: Contamination Potential under Conditions of Uncertainty. National Academy Press, Washington DC.
Pointer C. (2005). Groundwater and climate change. Report on the IAH working group of groundwater and climate change meeting, University of East Anglia, Norwich, UK; April 4–6.
Scibek J., Allen, D.M. (2006). Modeled impacts of predicted climate change on recharge and groundwater levels. Water Resour Res, 42(11):1-18.
Siebert, S., Burke, J., Faures, J.M., Frenken, K., Hoogeveen, J., Doll, P., and Portmann, F.T. (2010). Groundwater use for irrigation- aglobal inventory. Hydrology and Hearth Sciences Discussion, 3977-4021.
Toews, M.W. and Allen D.M. (2009) Evaluating different GCMs for predicting spatial recharge in an irrigated arid region. Journal of Hydrology, 374:265–81.
Twarakavi, N.K.C., D. Misra, and S. Bandopadhyay (2006). Prediction of arsenic in bedrock derived stream sediments at a gold mine site under conditions of sparse data. Natural Resources Research, 15:15-26.
van Grinsven H.J., Rabl A., de Kok T.M. (2010). Estimation of incidence and social cost of colon cancer due to nitrate in drinking water in the EU: a tentative cost-benefit assessment. Environ Health., 6;9:58. doi: 10.1186/1476-069X-9-58.
Vero S.E., Basu N.B., VanMeter K.J., Richards K.G., Melander P.E., Healyt M.G., Fenton O. (2018) Review: the environmental status and implication of the nitrate time lag in Europe and North America. Hydrogeol J,26(1):7-22.
Vrba, J. and Zaporozec, A. (1994) Guidebook on Mapping Groundwater Vulnerability, Vol. 16. International Contribution to Hydrogeology, Hannover, 131 p.
WWAP World Water Assessment Program (2009). The United Nations World Water Development Report 3: Water in a Changing wolrd 2009. UNESCO and London: Earthscan.
Zhao Zhou (2015). A Global assessment of Nitrate Contamination in Groundwater. Report IGRAC.