Agricultural pressures and status of aquatic ecosystems
Last update: 12/2019
River and lakes ecological status: definition and
current assessment
Human activities impact river and lakes through pollution, alteration of water flow regime and
modifications of channel morphology. All these actions result in multiple pressures on
freshwater ecosystems, undermining their biodiversity and ecological functioning. The European
Union has adopted an ambitious water policy, the Water Framework Directive (WFD), to reduce
pressures and achieve a good ecological status for all water bodies.
The ecological status is defined by a combination of biotic elements, comprehensive of
phytoplankton, flora, invertebrate and fish fauna, and abiotic conditions, encompassing flow
regime, water quality, and hydromorphological alterations. The WFD uses the ‘one out, all out’
principle when assessing water bodies, i.e. the worst status of the elements used in the
assessment determines the overall status of the water body.
In response to the WFD mandate, the EU Member States assess the ecological status of rivers,
lakes and coastal waters in their territory, and establish Programmes of Measures to reduce
significant anthropogenic pressures affecting the status. Based on EU Member States reports of
2004-2009, the dominant ecological status class for European rivers could be assessed.
Ecological status in this proxy is expressed in five classes — high, good, moderate, poor and
bad. Original data is provided by EU Member States (per single water body), using biological
assessment methods, but national classification scales have been harmonised by intercalibration
to assure their consistency at the EU level.
Since 2009, the ecological status of European water bodies has not improved overall, but some
biological quality elements have progressed (EEA, 2018). On a European scale, around 40 % of the surface water bodies are considered in good or
high ecological status or potential, with lakes and coastal waters having better status than
rivers and transitional waters.
Diffuse source pollution is reported to affect 38 % of surface water bodies and 35% of
groundwater bodies. The main impacts of the pressures on surface water bodies are nutrient
enrichment, chemical pollution and altered habitats due to morphological changes.
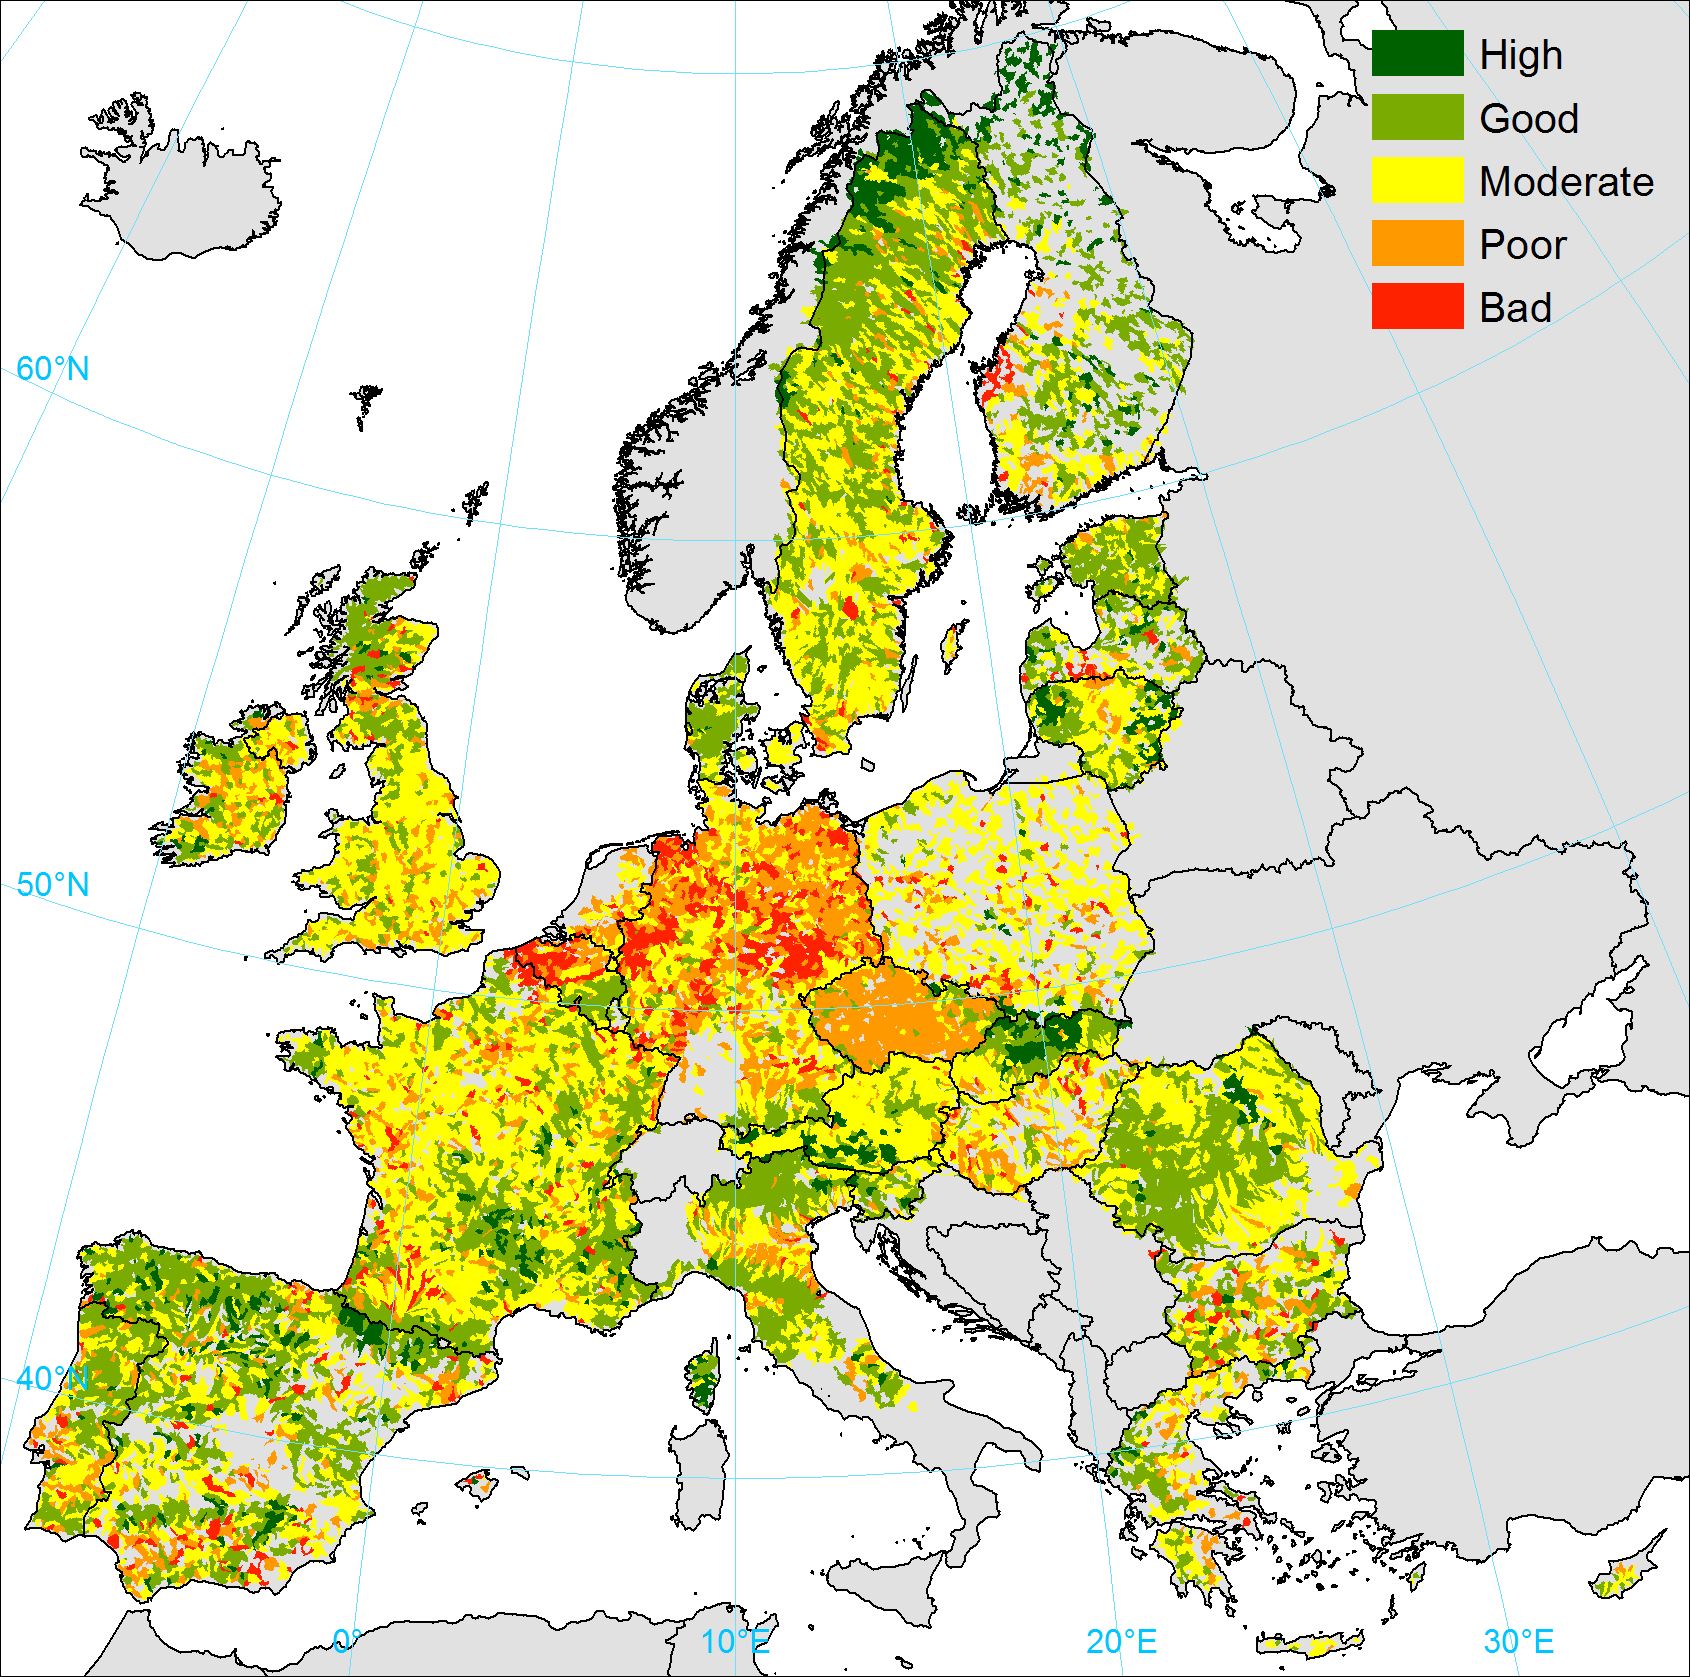
Ecological status of freshwater bodies in
Europe based on 2004-2009 EU Member States reporting
Dataand
statisticson the Ecological Status of European rivers, lakes, transitional and coastal water are
available directly at EEA website.
Pressures on aquatic systems
Ecological conditions are impacted by multiple pressures building up over time, and response
depends on local natural conditions and climatic variability. Disentangling and quantifying
cause and effect relationships between pressures and ecological functioning is thus a
challenging task. Yet understanding these links is necessary to plan effective policies and
restoration measures, as long-term availability of water resources and many benefits for people
depend on healthy aquatic ecosystems.
To help identify pressures acting on water bodies consistently across Europe and provide a
large-scale picture of water bodies’ status in Europe, the European Commission JRC developed a
set of 18 indicators that are related to the multiple
pressures acting on aquatic systems. The list is a selection of 56 types of pressures named by
the WFD Reporting Guidance (2016), and comprise main pressures acting on aquatic systems for
which European-wide coverage could be provided. Most indicators were assessed by pan-European
models, and informed by remote sensing data and European databases. While they are not meant to
substitute local assessments, JRC indicators enable mapping pressures homogeneously at the
European scale; locally they may provide complementary information for pressures that are not
otherwise addressed through local studies.
The role of agriculture
Agriculture, among the many human activities responsible of the alteration of their ecological
status, exerts significant pressures on aquatic systems. The main impacts of agriculture can be
summarized in:
Diffuse pollution
The excessive application of fertilizers and chemicals creates a surplus that is
washed off from land to river networks. High concentrations of nutrients (in
particular Nitrogen and Phosphorus) alter the trophic state of rivers and lakes,
while the toxicity of chemicals favours the survival of more resistant, pioneering
species. All these impacts alter the composition of biotic communities towards loss
of aquatic biodiversity.
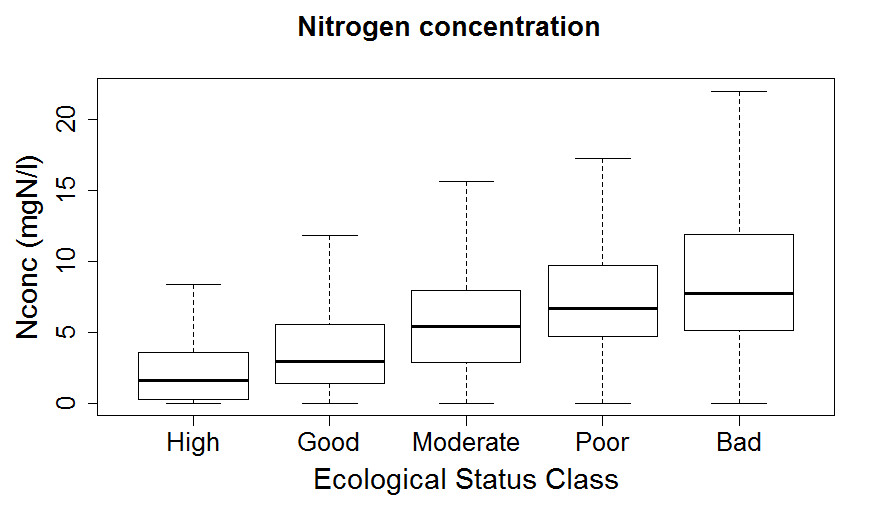
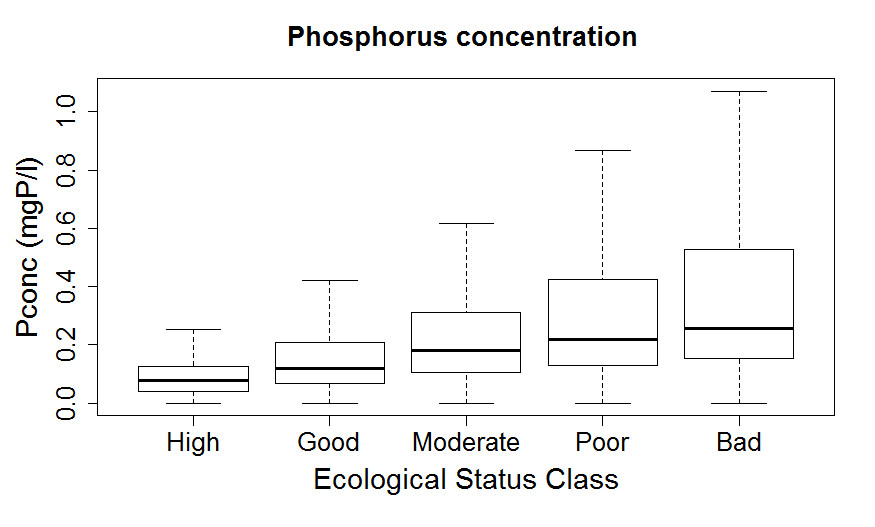
a)
b)
High concentrations of Nitrogen (a) and Phosphorus (b) in waters are correlated
to poor and bad ecological status of European rivers. Agriculture is among the
major contributor of nutrients in rivers
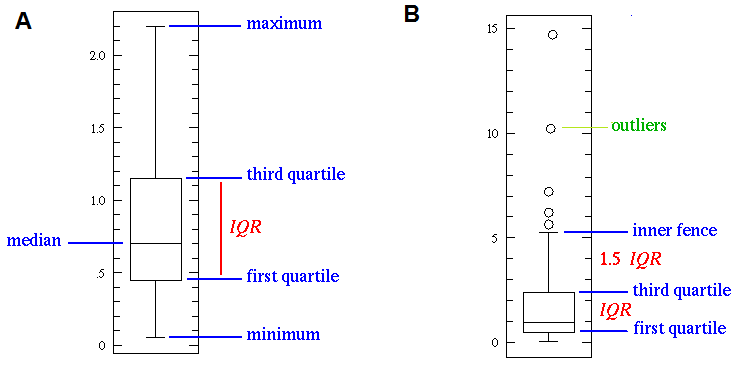
Boxplot explanation
The box plot is a standardized way of displaying the distribution of data based on
the five number summary: minimum, first quartile (25 percentile), median (50
percentile), third quartile (75 percentile), and maximum.
In the simplest box plot (left) the central rectangle spans the first quartile to
the third quartile (the interquartile range or IQR).
A segment inside the rectangle shows the median and "whiskers" above and below the
box show the locations of the minimum and maximum.
Outliers (right) are usually further away from the box than 1.5 times the length of
the box (IQR).
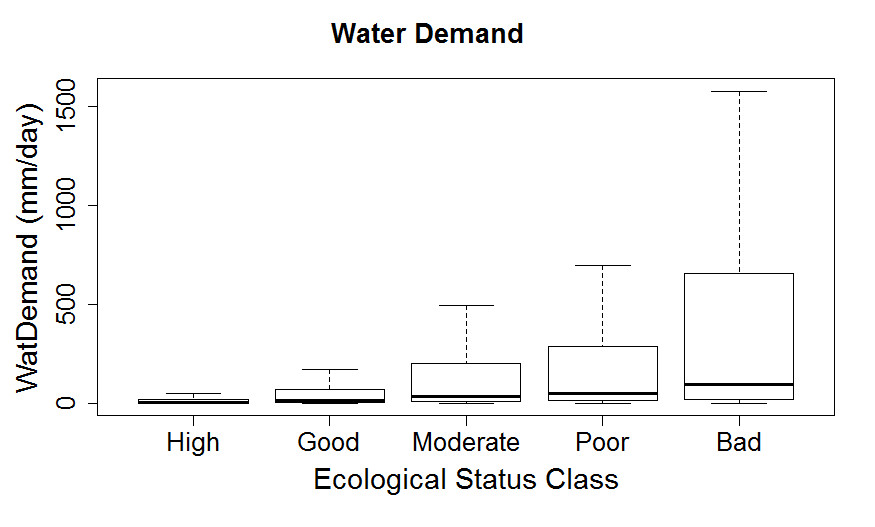
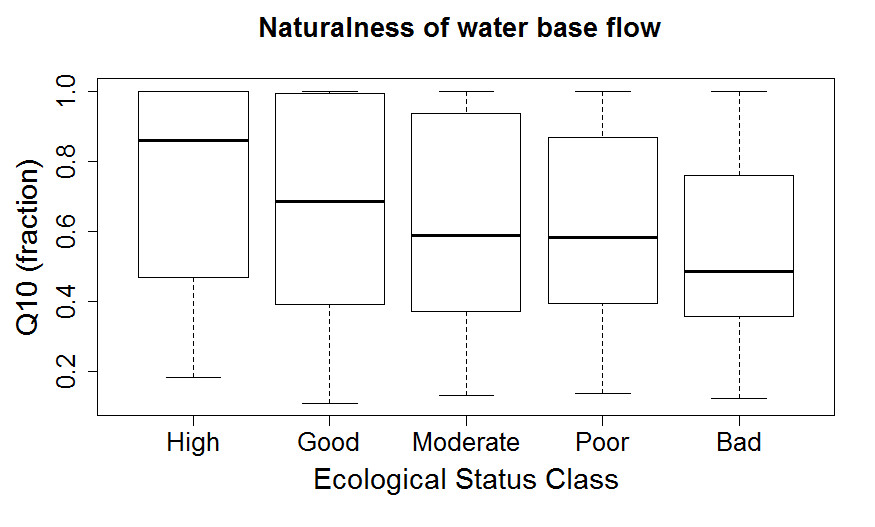
High water demand for
irrigation
The high and increasing withdrawal of water for irrigation reduces water volumes and
alters water regimes especially in Mediterranean water scarce regions, reducing
water flows below critical thresholds that are necessary to species survival. The
creation of dams and reservoirs to ensure water availability further disrupts flow
regime and longitudinal connectivity, interrupting habitat continuity.
a)
b)
Increase in water demand (a) and reduction of water flow (b), part of which can
be attributed to water use for irrigation, is correlated to poor and bad
ecological status of European rivers
Boxplot explanation
The box plot is a standardized way of displaying the distribution of data based on
the five number summary: minimum, first quartile (25 percentile), median (50
percentile), third quartile (75 percentile), and maximum.
In the simplest box plot (left) the central rectangle spans the first quartile to
the third quartile (the interquartile range or IQR).
A segment inside the rectangle shows the median and "whiskers" above and below the
box show the locations of the minimum and maximum.
Outliers (right) are usually further away from the box than 1.5 times the length of
the box (IQR).
Encroachment of riparian
areas
Cultivation of riparian land alters biodiversity along the streams, reduces stream
shadowing (thus contributing to increasing stream temperature), and reduces bank
resistance to water erosion.
The higher presence of agriculture in floodplains is correlated to poor and bad
ecological status of European rivers
Boxplot explanation
The box plot is a standardized way of displaying the distribution of data based on
the five number summary: minimum, first quartile (25 percentile), median (50
percentile), third quartile (75 percentile), and maximum.
In the simplest box plot (left) the central rectangle spans the first quartile to
the third quartile (the interquartile range or IQR).
A segment inside the rectangle shows the median and "whiskers" above and below the
box show the locations of the minimum and maximum.
Outliers (right) are usually further away from the box than 1.5 times the length of
the box (IQR).
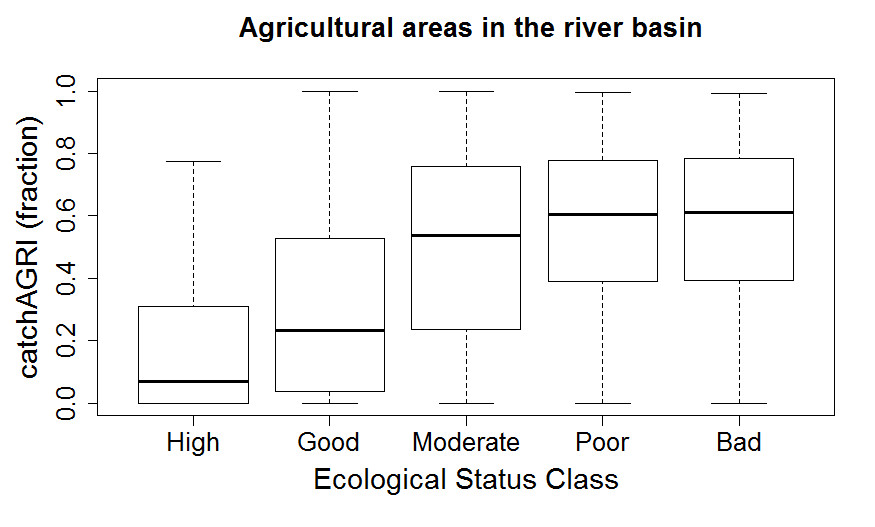
The overall impact of agriculture on ecological status can be visualized in the boxplot: when
agriculture occupies more than 50% of land, the ecological status of rivers is mostly
compromised.
Higher fractions of land use destined to
agriculture are correlated to poor and bad ecological status of European rivers
Boxplot explanation
The box plot is a standardized way of displaying the distribution of data based on the
five number summary: minimum, first quartile (25 percentile), median (50 percentile),
third quartile (75 percentile), and maximum.
In the simplest box plot (left) the central rectangle spans the first quartile to the
third quartile (the interquartile range or IQR).
A segment inside the rectangle shows the median and "whiskers" above and below the box
show the locations of the minimum and maximum.
Outliers (right) are usually further away from the box than 1.5 times the length of the
box (IQR).
Potential restoring actions
Ecological systems could respond differently to regime shifts, and restoration measures may not
necessarily return the ecological systems to their original state, thus potential outcomes of
restoration actions remains hard to predict. However, the empirical evidence provided by
European river conditions in relation to the set of pressure indicators may shed some light.
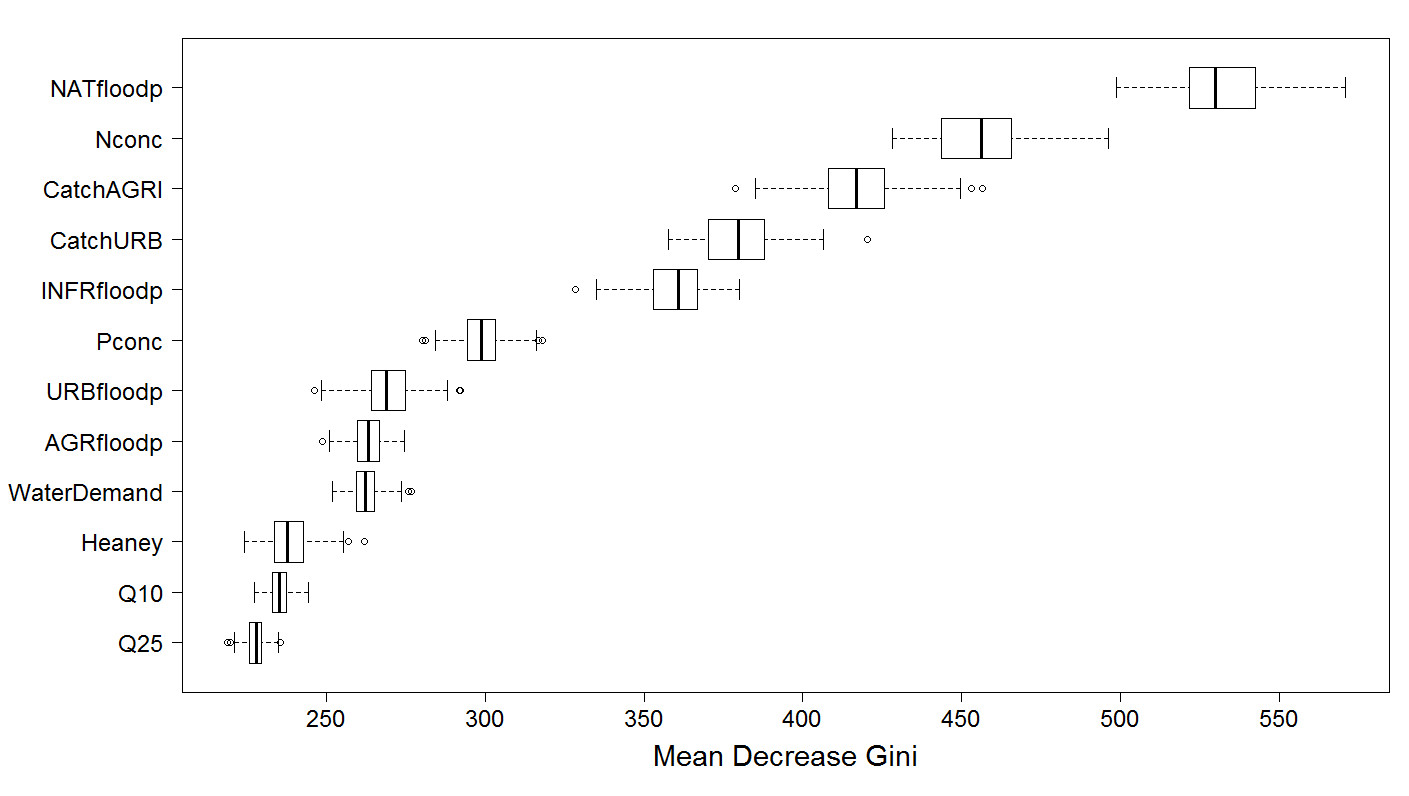
For example, statistical inference applied to the European situation of 2004-2009 in the form of
a random forest tree model, highlights the importance of maintaining natural vegetation in
floodplains and low concentrations of nitrogen in relation to good ecological status.
The power of single indicators in explaining
the ecological status class of European rivers, measured through the Gini index. A higher
Gini index indicate a higher explaining capacity of the variable
Boxplot explanation
The box plot is a standardized way of displaying the distribution of data based on the
five number summary: minimum, first quartile (25 percentile), median (50 percentile),
third quartile (75 percentile), and maximum.
In the simplest box plot (left) the central rectangle spans the first quartile to the
third quartile (the interquartile range or IQR).
A segment inside the rectangle shows the median and "whiskers" above and below the box
show the locations of the minimum and maximum.
Outliers (right) are usually further away from the box than 1.5 times the length of the
box (IQR).
In applying this statistical model to European conditions, it could be estimated that 4% of EU
catchments with degraded rivers would achieve a good ecological status by reducing nitrogen
pollution and increasing natural areas in floodplains by 10%, and up to 8% of catchments could
meet the policy target if the same measures were raised to 20%. However, this is a conservative
estimation, as the methods do not account for the cascading effect of improving the ecological
quality in one catchment on the downstream area.