Case studies and overview
It is now largely recognized that eutrophication of marine and freshwater results from high inputs of anthropogenic nutrients (nitrogen and/or phosphorus) and their imbalance over silica. Indeed, the excess of nitrogen or phosphorus in relation to silica, coming naturally from rock weathering, leads a shift from diatoms, well palatable for the food web, to harmful algal blooms (HAB; Billen and Garnier, 1997; Justić et al., 1995; Heisler et al. 2008; Viaroli et al., 2008; Howarth et al., 2011).
Scientific literature dealing with the land-to-sea continuum, integrating diffuse nutrient
loading from agricultural activities in the watershed with their impact on the coastal zone, is
limited (but see Lancelot et al., 2011; Passy et al., 2016; Desmit et al., 2018; Garnier et al.,
2019a).
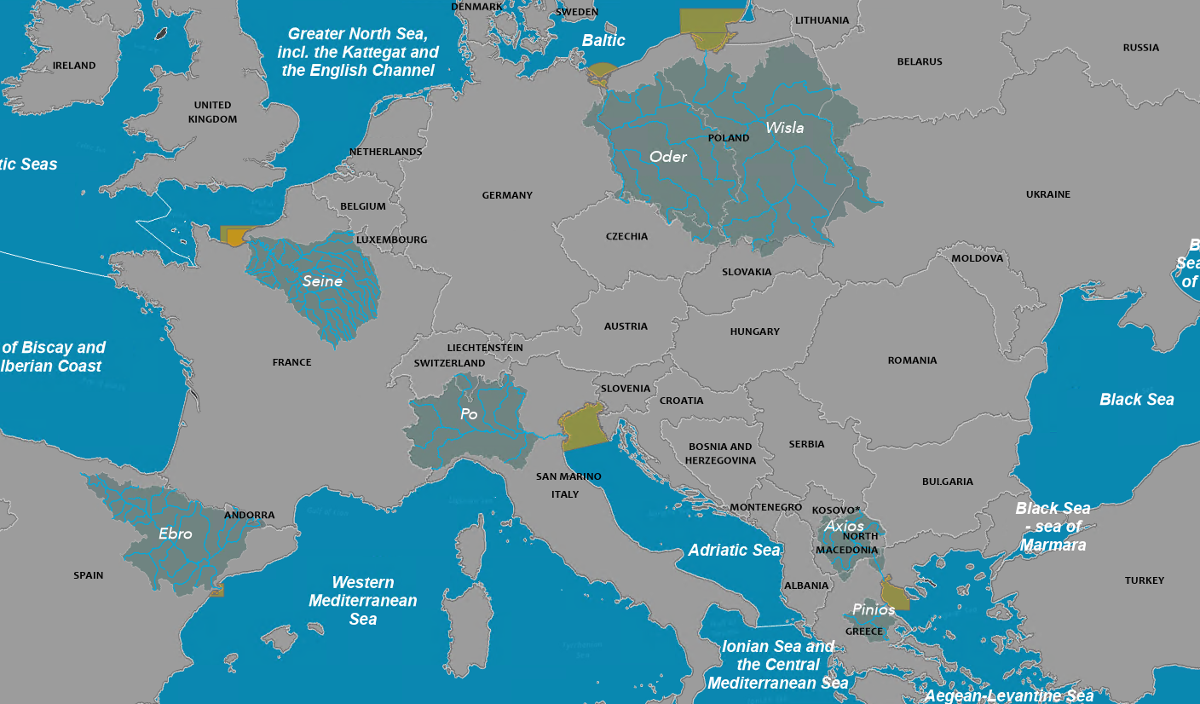
Information on eutrophication was collected at emblematic rivers and adjacent coastal zones
across Europe: Oder, Vistula, Po, Ebro, Axios, Pinios, and Seine Rivers. The amount of riverine
deliveries of nitrogen, phosphorus and silica were analyzed in terms of loads and their ratios.
Information on water quality fluxes deliveries after the 2000s has been drawn from the
scientific literature, and put in relation to the characteristics of the river-influenced
coastal zones (morphology and residence time).
In Europe agriculture is an important part of the economy. Nitrogen pollution of water is mainly
from diffuse sources, leaching from large amounts of mineral fertilizers applied since the
1950’s for boosting agricultural food and feed production (Marshall Plan of 1947; Common
Agricultural Policy - CAP, of 1957, which entered into practice in 1962), resulting in
intensification and specialization of agriculture. This is mostly the situation in France,
Italy, Spain, Germany and Poland, i.e. of Seine, Po, Ebro, Oder and Vistula rivers.
In the recent decades however, Greece has developed agricultural activities in the alluvial
plains of the Pinios and Axios Rivers, where better management of fertilization is also
necessary (Fytianos et al., 2002; Stefanidis et al., 2016).
In these basins, water availability for agriculture is controlled either by tile drainage (Seine
–5% of watershed area, Oder and Vistula – about 30%) or through irrigation, particularly in
Mediterranean Rivers (Ebro, Po, Pinios and Axios). For example, more than 90% of the water is
used for agriculture in the Axios River (Chatzinikolaou et al., 2010; Psomas et al., 2016).
In all cases, water regulation delivery requires heavy infrastructure of dams, reservoirs, and
canals.
Strategies for reduction of impact of anthropogenic eutrophication
Several national, regional and EU Directives have been enacted to reduce the impact of
anthropogenic eutrophication in continental waters and at the coastal zone, among which the
Water Framework Directive (WFD; 2000), and the Marine Strategy Framework Directive (MSFD, 2008).
Notwithstanding the WFD and the Urban Waste Water Treatment Directive (UWWTD) led to significant
nutrient load reduction (especially phosphorus) to watersheds and deliveries to the marine
waters (Grizzetti et al., 2012; Romero et al., 2014), coastal eutrophication persists in many
areas.
In parallel, the CAP has evolved considerably, in particular with the creation of the second
pillar (1999, for rural development) and within the CAP, many options have been introduced for
the current phase 2015-2020, leaving more initiative to Member States.
Despite a common target for rural development making European agriculture more environmentally
friendly, nitrogen deliveries to coastal zones hardly decreased or remained stable (Garnier et
al., 2019b).
Impacts of nutrient reduction deliveries
Because phosphorus is assumed to be the limiting nutrient in freshwaters, and nitrogen the limiting one in marine systems (Elser et al., 2007), the important decrease in phosphorus, leading to an excess of nitrogen to phosphorus, is consistent with the observation of a strong reduction of eutrophication in rivers (Loire: Minaudo et al., 2015; Seine: Garnier et al., 2020; Ebro: Torrecilla et al., 2005) contrasted by the concurrent persistence of eutrophication in marine coastal zones.
Indeed, despite nutrients reduction, coastal bays still experience episodic eutrophication
crisis (North Adriatic Bay for the Pinios and Axios River in 2005–2007: Cozzi and Giani, 2011;
Seine Bight with ASP and DSP crisis in 2004 and 2005 respectively: Passy et al., 2016; Menesguen
et al., 2018; Garnier et al., 2019; Thorel et al., 2017; Alfacs Bay for a branch of the Ebro:
Busch et al., 2016; Quijano-Scheggia et al., 2008, Fernández-Tejedor et al., 2009; Gdansk Gulf
for the Vistula River and Pomeranian Bay and Szchecin estuary for the Oder and more generally
South Baltic Sea in 2008-2009: Kudryavtseva et al., 2019; Berthold et al. 2018).
Eutrophication takes various forms with development of harmful algal blooms (HAB), with
accumulation of mucilaginous algae, or dinoflagellates, Cyanobacteria, Pseudo-Nitzschia possibly
producing toxic substances, all leading to hypoxia, and even macro-algae which in such poor
oxygen conditions produce hydrogen sulfide emission, a broad-spectrum poison.
Understanding the conditions for recovery of coastal ecosystems requires considering complex biological processes, which do not just respond mechanically to nutrient reductions, but are also occurring in a changing environment, e.g. climate change (temperature and hydrological changes), micropollutants (pesticides, etc), i.e. in the context of a moving baseline (Duarte et al., 2009; 2015; Berthold et al., 2018).
Nutrient flux imbalance
In France, point source emissions of the largest WWTPs have been reduced by 95% for phosphorus
and 60 % for nitrogen from the 1990s (Rocher and Azimi, 2017). Yet, Seine nitrogen delivery to
the coastal zone has increased by 10-20 % whereas phosphorus has decreased by 55% for this same
period (Passy et al., 2013; Billen et al., 2001; Garnier et al., 2019a).
In Germany, reductions of point source emissions in 2000-2010 have been of around 70 % for
phosphorus, but only 13% for nitrogen (Nausch et al. 2011, in Berthold et al. 2018). Kowalkowski
et al. (2012) showed that phosphorus has been reduced more than nitrogen in the Oder and Vistula
rivers, and a similar pattern is found for many rivers in Europe (Grizzetti et al., 2012; Romero
et al., 2013).
Indicator for Coastal Eutrophication Potential
The nutrient imbalance can be quantified using the Indicator for Coastal Eutrophication Potential (ICEP; Redfield et al., 1963; Conley et al., 1989), which measures the excess of nitrogen or phosphorus over silica (Billen and Garnier, 2007; Garnier et al., 2010). ICEP considers total nitrogen, phosphorus and silica fluxes (including dissolved or particulate forms), and is expressed in Carbon units.
To help comparison among rivers, ICEP is normalized per km2 of watershed area.
An ICEP value close to zero indicates equilibrium between nitrogen or phosphorus and silica,
whereas positive or negative values mean an excess or deficit with respect to silica.
A measurable target for eutrophication control would be to reach values of both ICEP-P and
ICEP-N close to zero, in line with several works postulating the need for a reduction of both
nitrogen and phosphorus to control primary production (Howarth and Marino, 2006) and even
promoting the role of silica.
The ICEP-P (P:Si) for the representative rivers are all close to zero (Table 1; total nitrogen
and total phosphorus were estimated with Grizzetti et al., 2012; silica was retrieved from
monitored data published in literature; river discharge is the mean annual average over about 10
years), although slightly negative for the Po, Axios and Pinios Rivers, and slightly positive
for the others.
These values indicate that a balance has been reached between phosphorus and silica, with the
generalization of improvement of wastewater treatments.
Interestingly, however, some studies consider that phosphorus should be further reduced,
especially in rivers flowing to the Baltic Sea, where Cyanobacteria dominate the HABs.
Cyanobacteria are particularly able to store phosphorus in their cells (Ritchie et al., 2001),
and may ensure their nitrogen needs through atmospheric N2 fixation (Molot et al., 2017).
Whereas nitrogen appears to be the nutrient in excess to silica and phosphorus, phosphorus losses from soils must not be neglected. Indeed in many EU countries, phosphorus has accumulated in soils; accelerated soil erosion, e.g. triggered by poor soil cover management or climate change, could lead to a raise in particulate phosphorus losses.
| River | Basin drainage area | Mean annual discharge at outlet | ICEP-P | ICEP-N | Main basin country |
|---|---|---|---|---|---|
| [km2] | [m3/s] | [kgC/km2/d] | [kgC/km2/d] | ||
| Vistula | 193894 | 1040 | 0.29 | 4.81 | Poland |
| Oder | 118938 | 547 | 1.88 | 7.83 | Poland, Germany and Czechia |
| Ebro* | 85611/3590 | 277/11.7 | 1.30 | 2.99 | Spain |
| Seine | 73224 | 583 | 0.27 | 14.21 | France |
| Po** | 71327/89684 | 1513/1819 | -0.10 | 14.8 | Italy |
| Axios | 24397 | 101 | -0.83 | -0.01 | North Macedonia, Greece |
| Pinios | 10701 | 78.66 | -5.39 | -0.67 | Greece |
*Branches and Canals of the Ebro Delta feed two small confined bays, the bays of Alfacs and Fangar, south- and northward, respectively. The Alfacs Bay, which is more documented in the literature, was chosen here. The discharge reaching Alfacs Bay was found in the publication by Fernández-Nóvoa et al. (2015), and the surface area was calculated pro rata the discharge. For drainage area and discharge values, the first figure corresponds to the whole Ebro basin, the second to the Alfacs Bay.
** The coastal zone taken into account for the Po additionally receives input fluxes from three smaller rivers (Adige, Brenta, and Piave Rivers) that are taken into consideration for their respective discharges and watershed areas. For drainage area and discharge values, the first figure corresponds to the whole Po basin, the second includes the Adige, Brenta, and Piave Rivers.
Conversely, ICEP-N values are largely positive for the Seine and the Po rivers (~15 kgC/km2/d), positive for the Oder, Vistula, and Ebro Rivers (3-8 kgC/km2/d), and negative for the Pinios and Axios Rivers (< -1 kgC/km 2/d; Table 1).
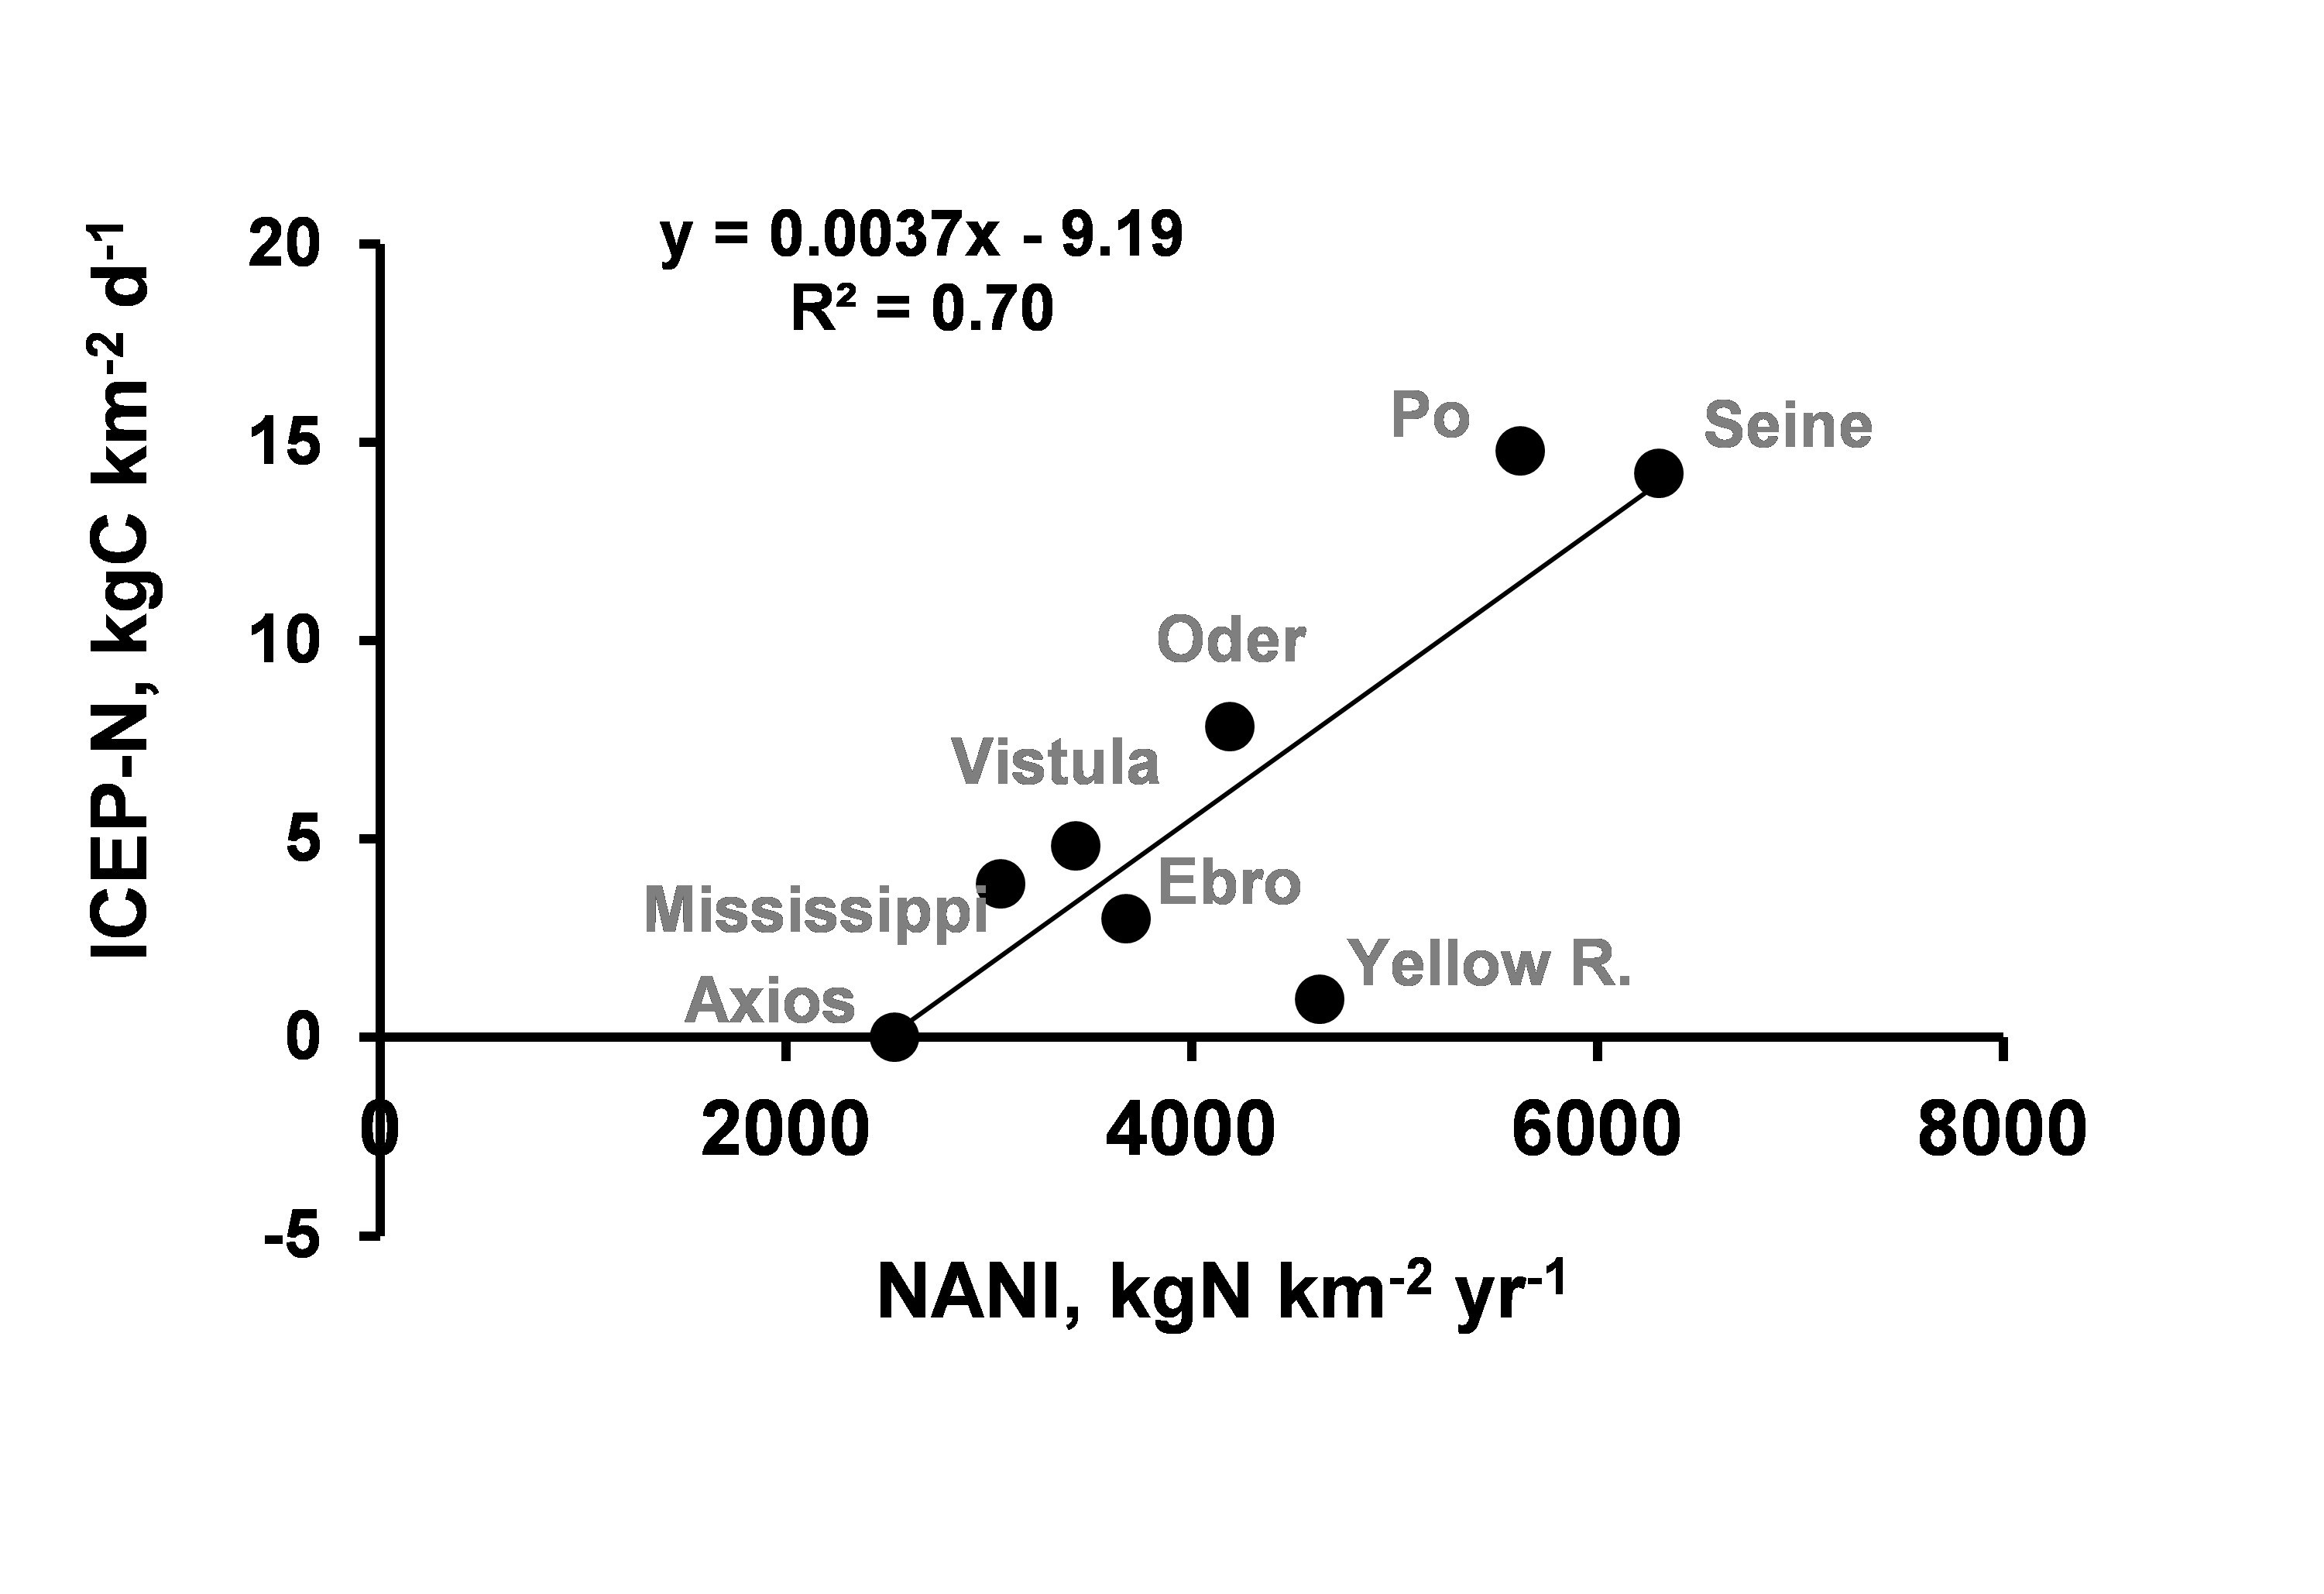
The Net Anthropogenic N Input (NANI; Howarth et al., 1996) is a good proxy of environmental
impact of agriculture, reflecting the amount of reactive N potentially exposed to be lost to the
environment and therefore to the hydrosystem, either through leaching from agricultural soils or
through the release of urban wastewater. Indeed, a high NANI can lead to high leaching,
especially when fertilization is applied in the form of mineral nitrate
(NO3-), a very mobile ion.
Mean annual NANI values expressed in kg per km2 of watershed area, were taken from a
previous study by Billen et al. (2010), based on the Global News database (Seitzinger et al.,
2010). Plotting the ICEP-N values for each river against NANI shows a significant linear
relationship (Figure 1), suggesting that ICEP-N is driven by reactive N inputs, mostly related
to agricultural use of fertilizers.
Characteristics of the receiving coastal systems
ICEP provides information on the balance/imbalance of nutrient fluxes delivered by river to coastal areas, and the resulting potentiality to support new primary production of harmful algae. It does not however consider the variety of characteristics of the receiving coastal systems, which is a major limitation of the approach. Besides nutrient inputs, coastal eutrophication depends on many factors linked to the morphology and hydrological cycle of the receiving water body, like the flushing rate or residence time, temperature and light conditions, wind, etc., that vary seasonally and inter-annually (Friedland et al., 2019; Berthold et al., 2018; Duarte et al., 2009; 2015).
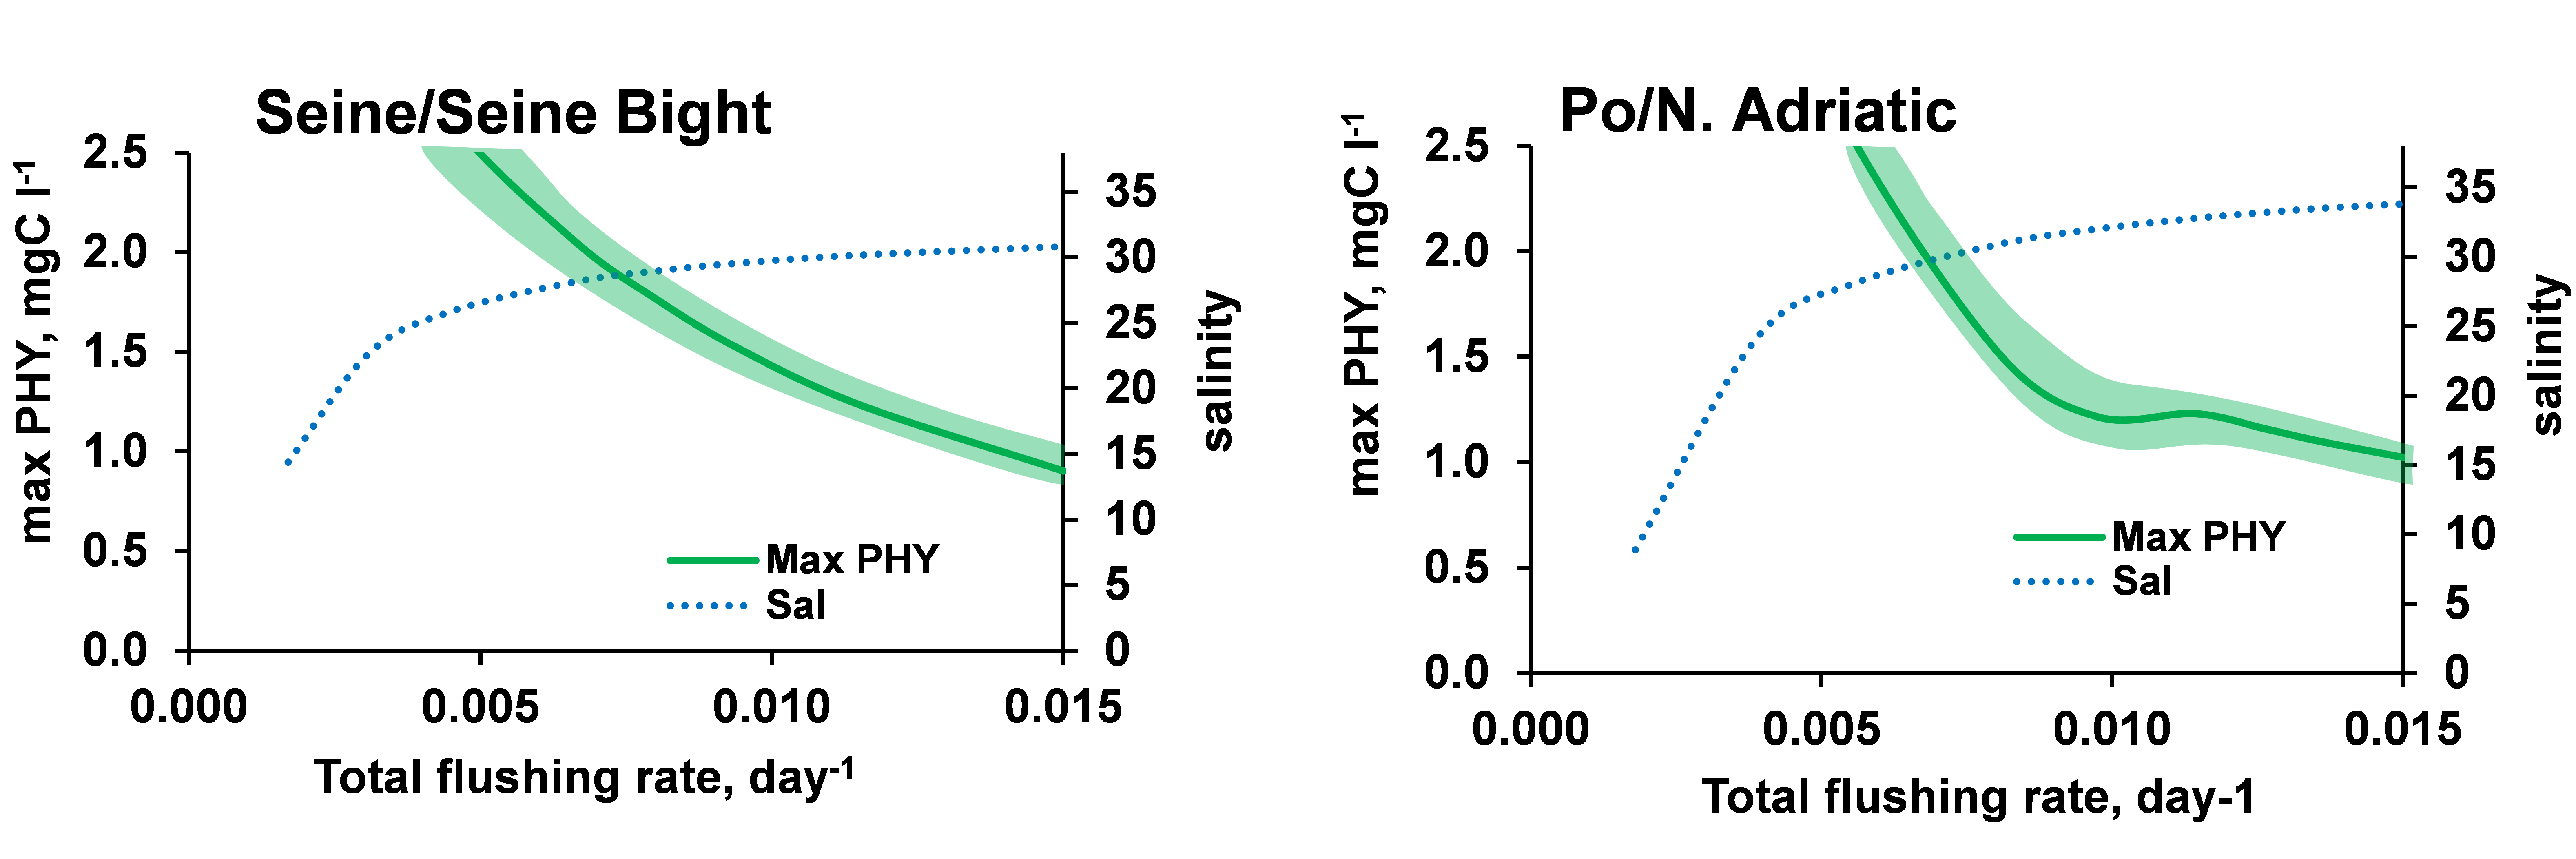
We explored the complex relationships between river nutrient deliveries and marine bay characteristics (flushing rate, extinction coefficient). The total flushing rate was varied in the range of 0.001–0.015 d-1. The total flushing rate is limited at a low end by the flushing determined by the river discharge. Average salinity in the bay reflects the mixing conditions by the river and the oceanic currents.
The maximal biomass of phytoplankton calculated in the bay decreases as a function of the increasing total flushing rate (e.g. Po and Seine are shown in Figure 2). A low flushing rate, e.g., a residence time of more than 2 years, makes the bay a stagnant system, which leads to a high potential for phytoplankton biomass, limited only by nutrients and available light. Algal biomass decreases with increasing flushing rates. Algal biomass does not appear to be very sensitive to the value of the extinction coefficient, which was explored in a range of +/-0.05 m-1.
B_ICEP indicator
This leads to define a new indicator of coastal potential eutrophication, derived from ICEP, that takes into account volume and residence time of the receiving bay, and represents the excess non siliceous algal biomass concentration potentially developed in the coastal bay under optimum light conditions, the B_ICEP (expressed in mgC/L; Garnier et al., 2020).
B_ICEP is defined by dividing the total flux of nutrient in excess over silica (ICEP × watershed
area) by the ratio of the bay volume to its residence time.
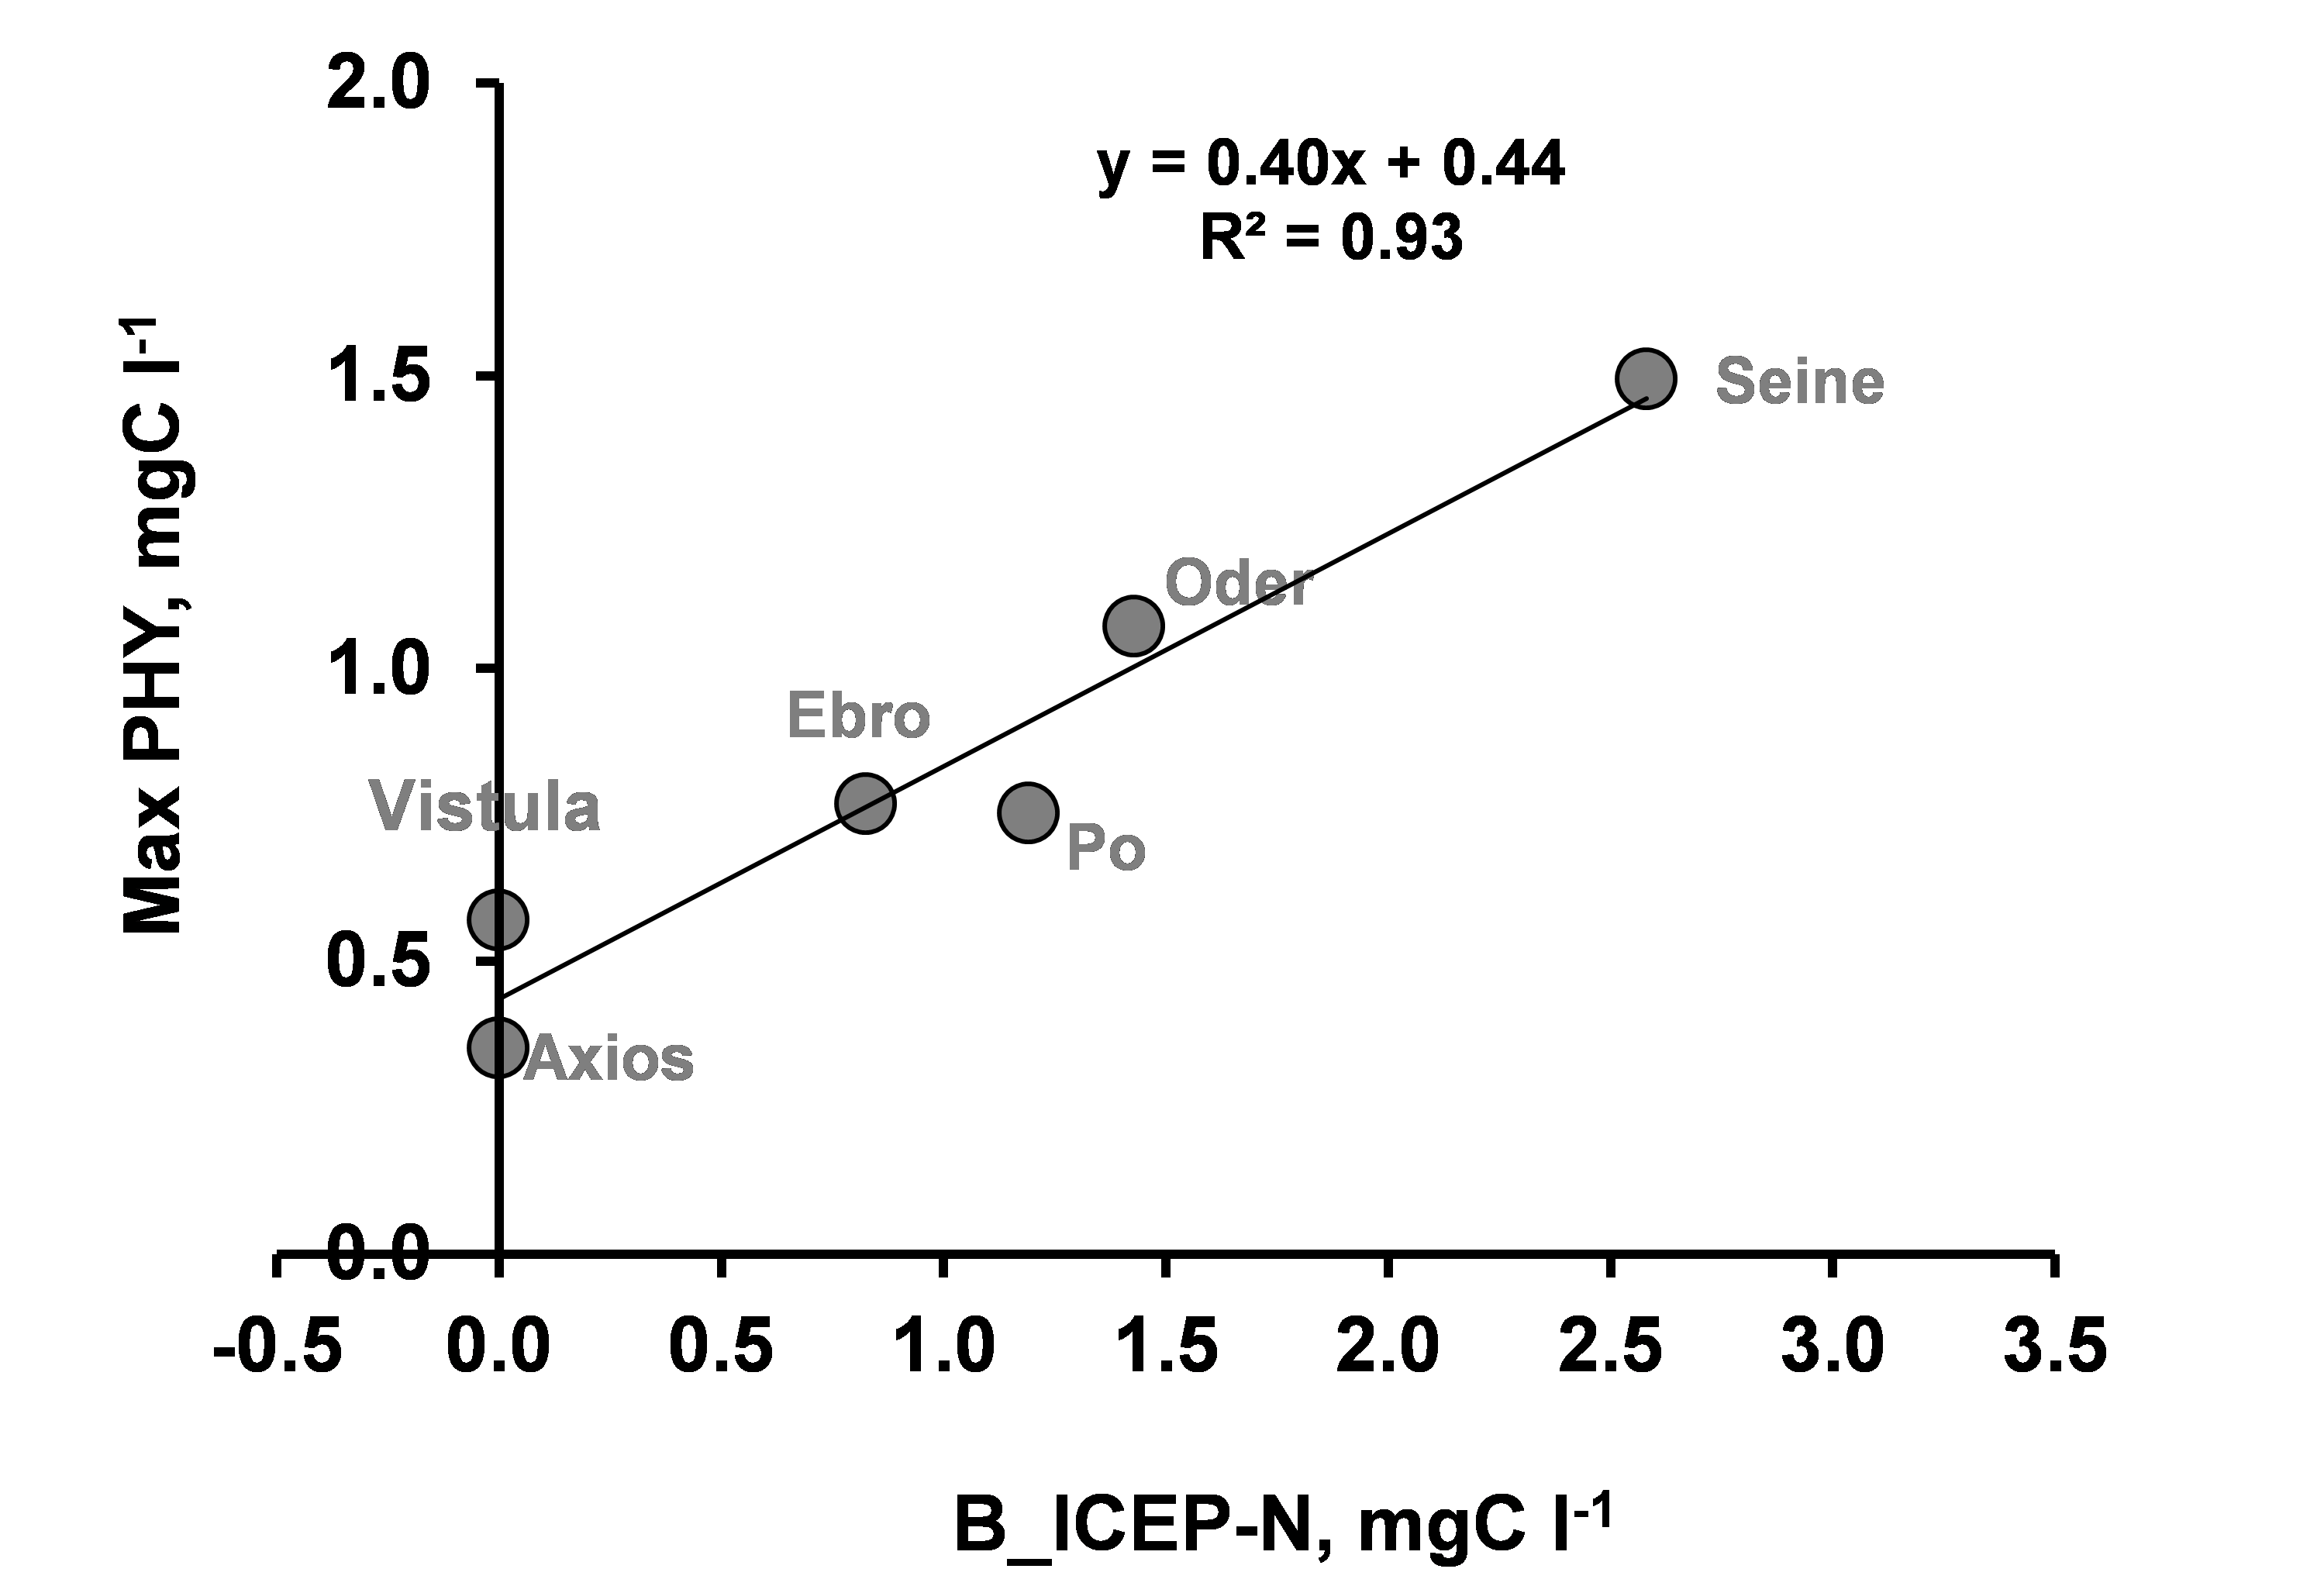
Comparing the observed maximum algal biomass in the receiving bay of the seven rivers with the
corresponding B_ICEP-N, shows that the latter is indeed a good predictor of the manifestation of
eutrophication (Figure 3). Note that a biomass of 1.5 mgC/L, corresponding to a chlorophyll
value of 50 µg/L, is a relatively high value for a coastal marine system, considering a C:Chl
ratio of 32 for a 7578 data set in temperate estuarine and coastal open water systems (Jakobsen
and Markager, 2016).
NB: a. For the Ebro, only the branch flowing to Alfacs Bay, south of the delta, is considered.
b. Information for the characteristics of the Pinios coastal zone cannot be relied on, so that B_ICEP value was discarded.
Integrated policies
Eutrophication can only be reduced by an integrative view and regionally adapted policies for stoichiometric rebalancing. For a full integrated view of the land-to-sea continuum, inputs to the rivers from rural areas (from agricultural and forest land) and urban zones (domestic waste discharges, industries, combined sewer overflows, etc.) must be taken into account to explore potential management strategies.
Generally freshwater and marine scientific communities are relatively disconnected; the first
often focus on surface waters, ground waters, soils and agronomy, whereas the latter often look
at estuaries, coastal zones and open oceans separately. Collaborations for a full understanding
of a land to sea continuum are therefore rare, but insightful for exploring agricultural
management scenarios (Cugier et al., 2005; Passy et al., 2013; Lancelot et al., 2007; 2011;
Desmit et al., 2018; Garnier et al., 2019a).
With the alignment of WFD and MSFD, more research is ongoing, and results should appear in the
nearby future. In the view of the discussion above, research should address some important
knowledge gaps, such as
- data and modelling on silica fluxes
- seasonal variations of nitrogen, phosphorus, and silica fluxes
- hydro-morphological characteristics of impacted coastal systems.
As a whole, future efforts have to integrate the variety of scientific disciplines and tools to
define and meet targets that could stop coastal eutrophication.
Deep changes in agricultural systems are necessary to reduce nitrogen fluxes to coastal areas.
Yet, recovery outcomes may be delayed due to past management legacy; lack of tangible results of
recovery efforts may discourage farmers and society in further investing to restore coastal
ecosystems. Human Sciences scientists should be involved in the eutrophication and agriculture
debate, analyzing desirable outcomes, perceptions, frustrations and efficient solutions for the
well-being of the population and the environment.
Fact sheets
References
Acknowledgement
The content of this web page is based on the scientific review prepared by Dr. Josette Garnier, Sorbonne Université – CNRS, Paris, France